
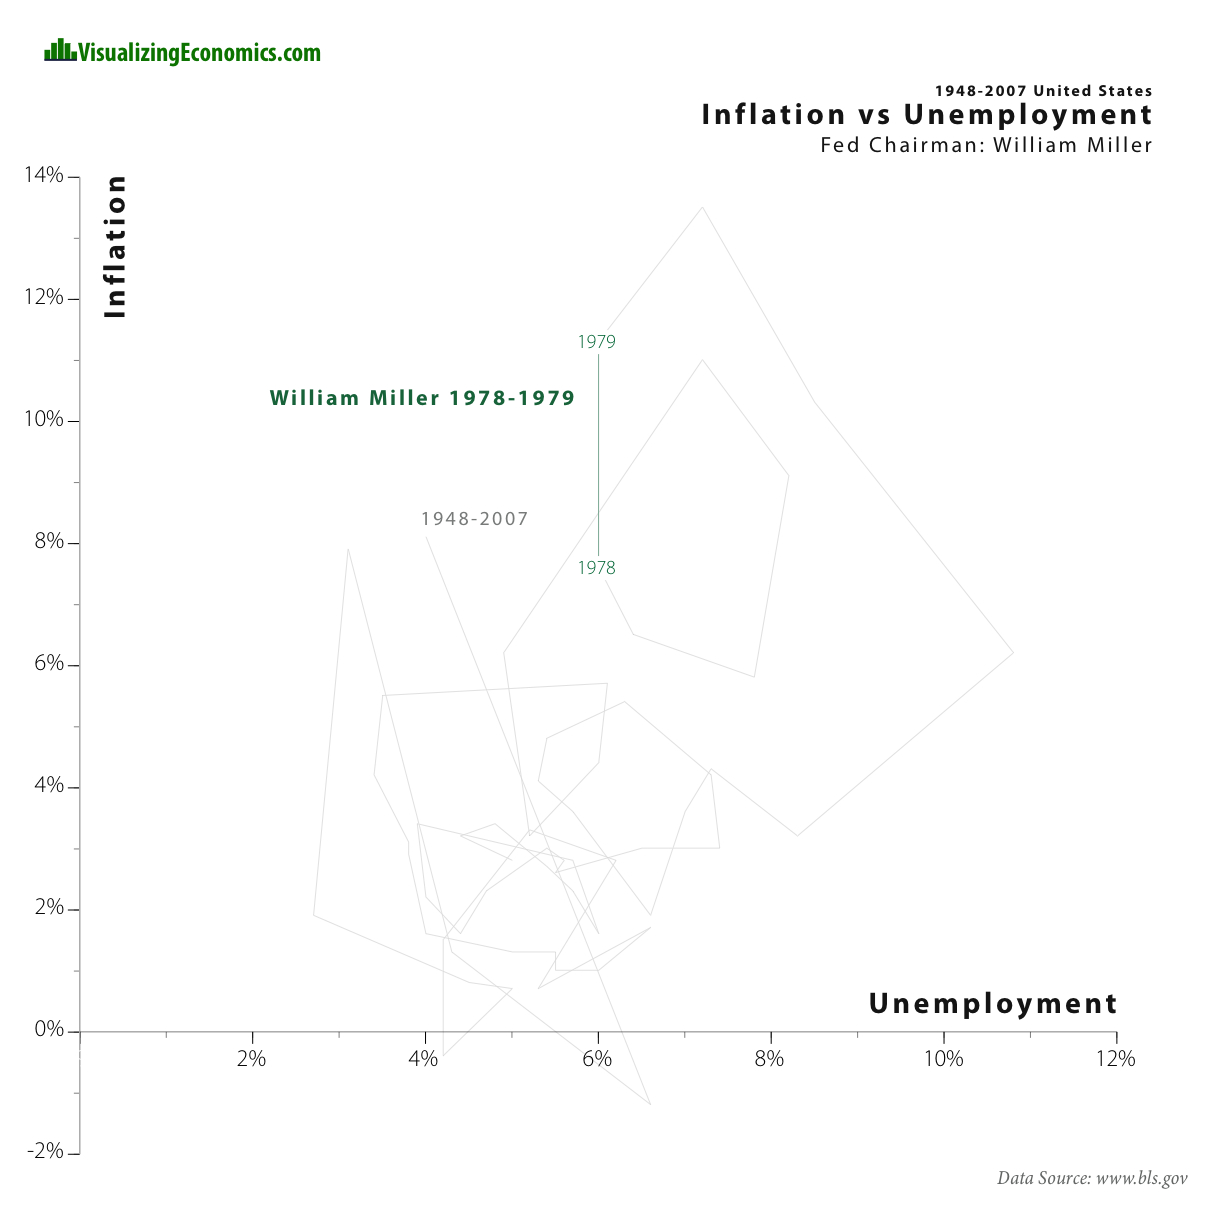
I have plotted the annual inflation (CPI-U) vs unemployment. The green line represents the time William Miller was the Fed Chairmen (March 8, 1978 – August 6, 1979). The gray line represent the years 1948-2007.
{Click on the image to take a closer look}
![]()
The series of plots I have been posting, look at the relationship between inflation and unemployment. In traditional economic theory, the Phillips curve predicts that as inflation goes up unemployment goes down. However, this was true only up to the late 60s in the United States.
Data from Bureau of Labor Statistics
[tags]United States, Inflation, Unemployment[/tags]