Mastodon

Wages

Changes in Income Growth Rates since 1970

From An Illustrated Guide to Income in the United States.

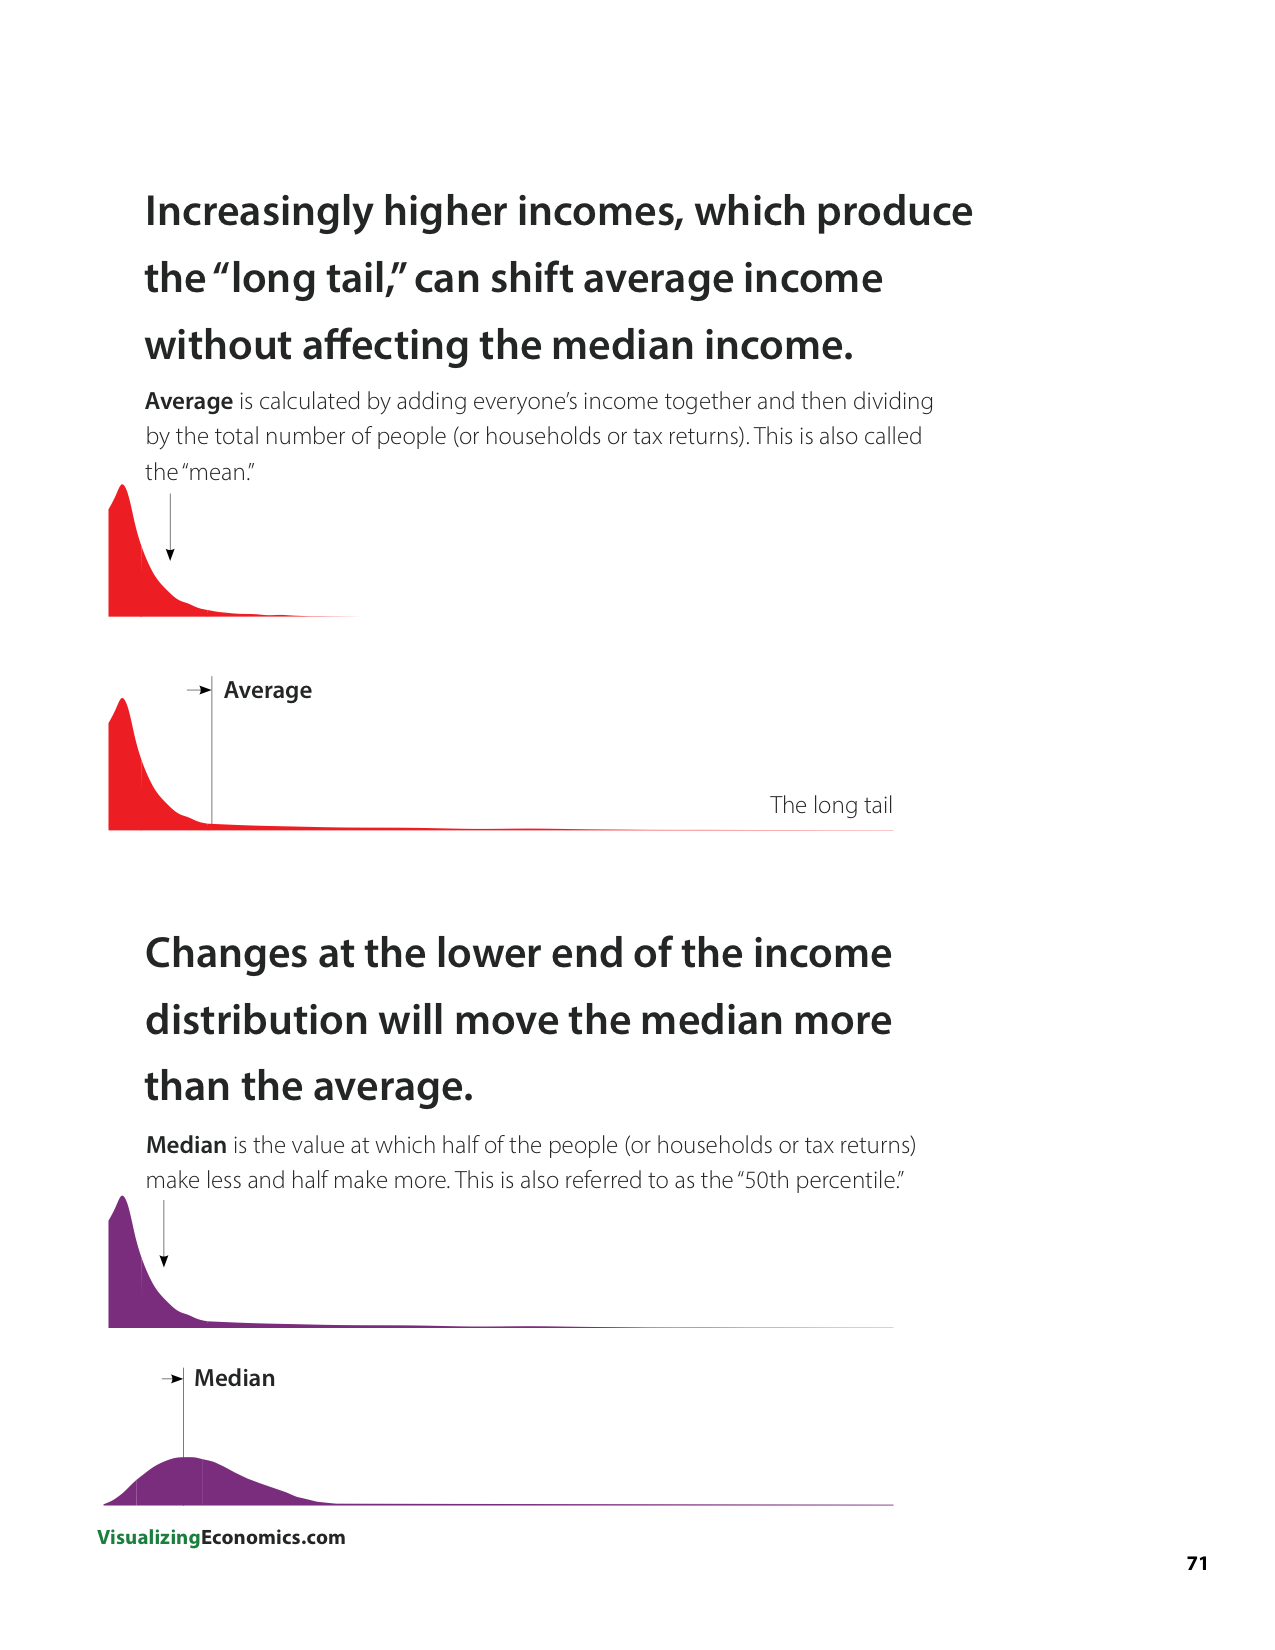
Growing income inequality can be seen across many different statistics in my book. For example when average and median incomes diverge, this is a red flag for growing inequality since the increasingly higher incomes that can be found among corporate executives, celebrity and hedge fund mangers can shift average income without affecting the median* income. 

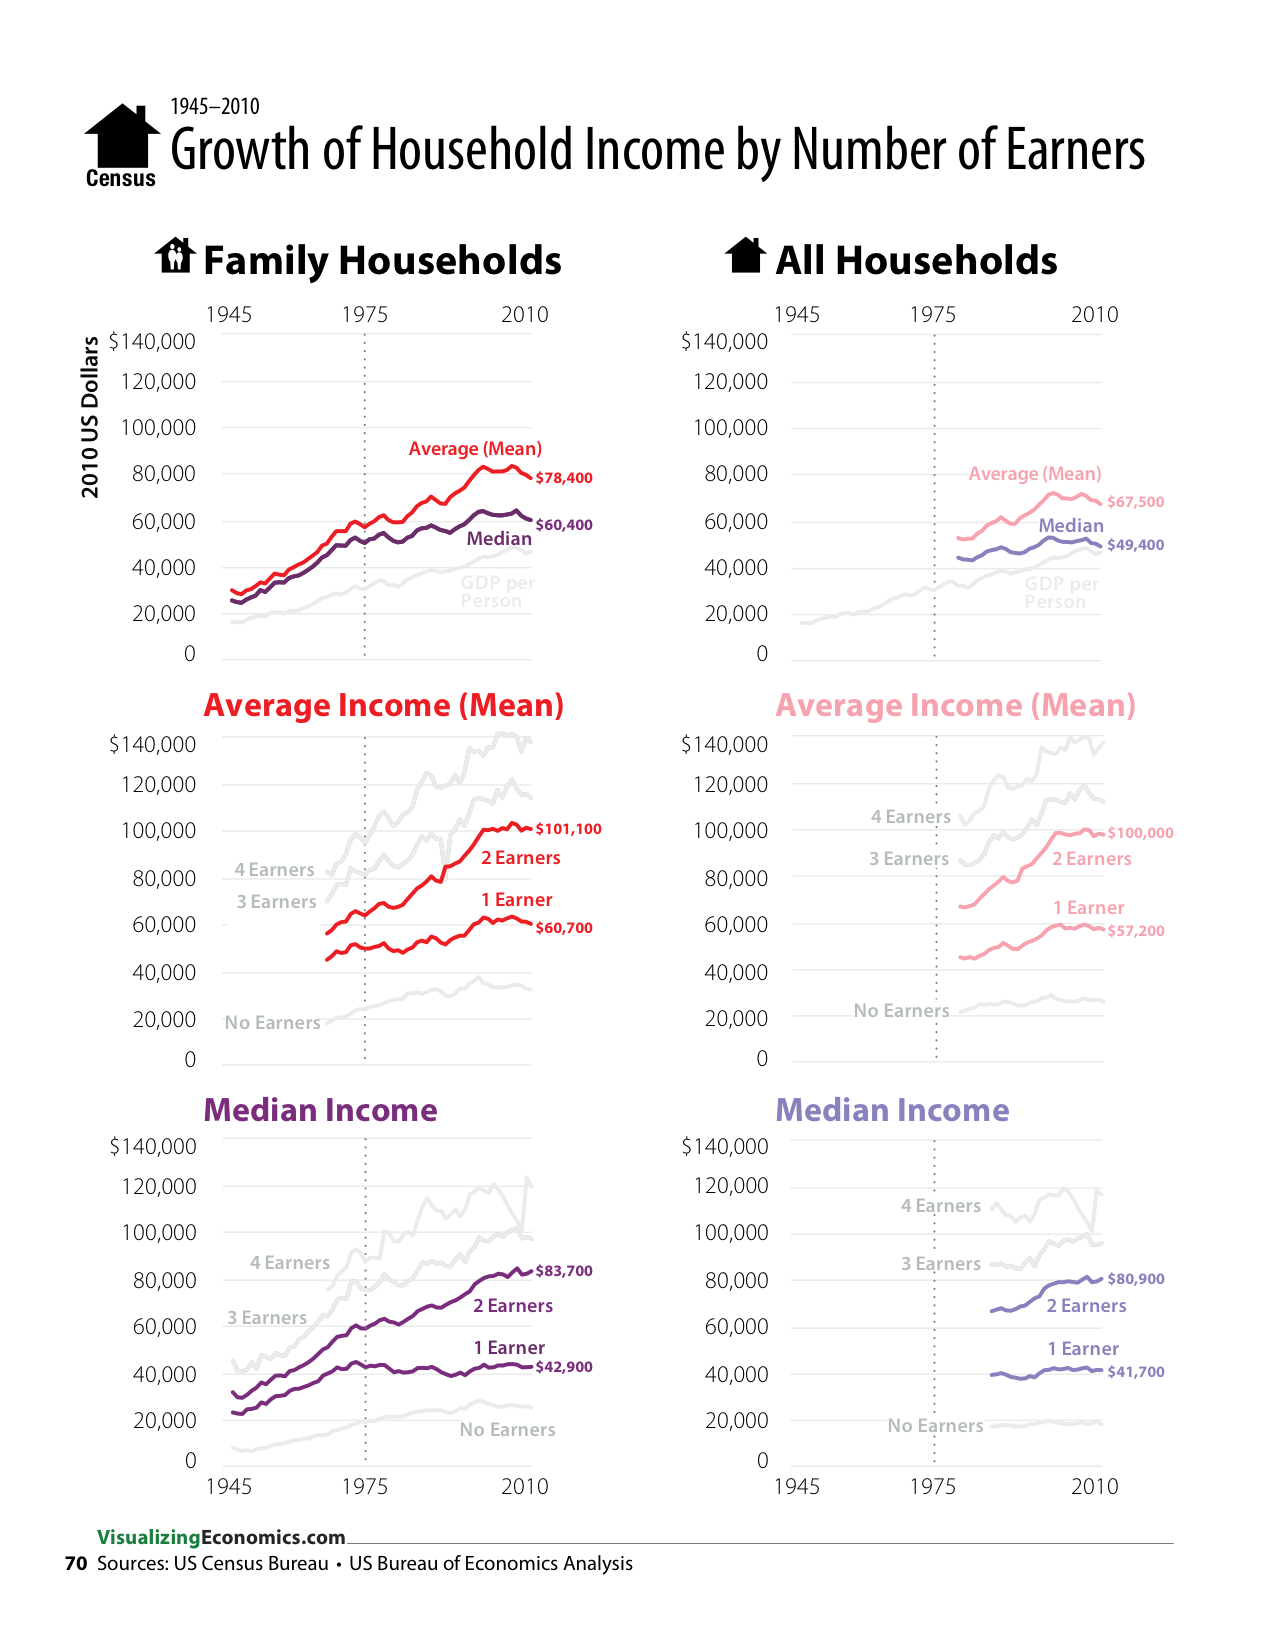
Take a look at how the average (mean) and median income diverge for family households over the last 35 years. This implies that the income growth of lower-income households has not kept up with the income growth high-income households. Over the same time period, the median income of family households with only 1 income earner didn't change while the median income of 2, 3, 4 and no earner households continued to grow. 

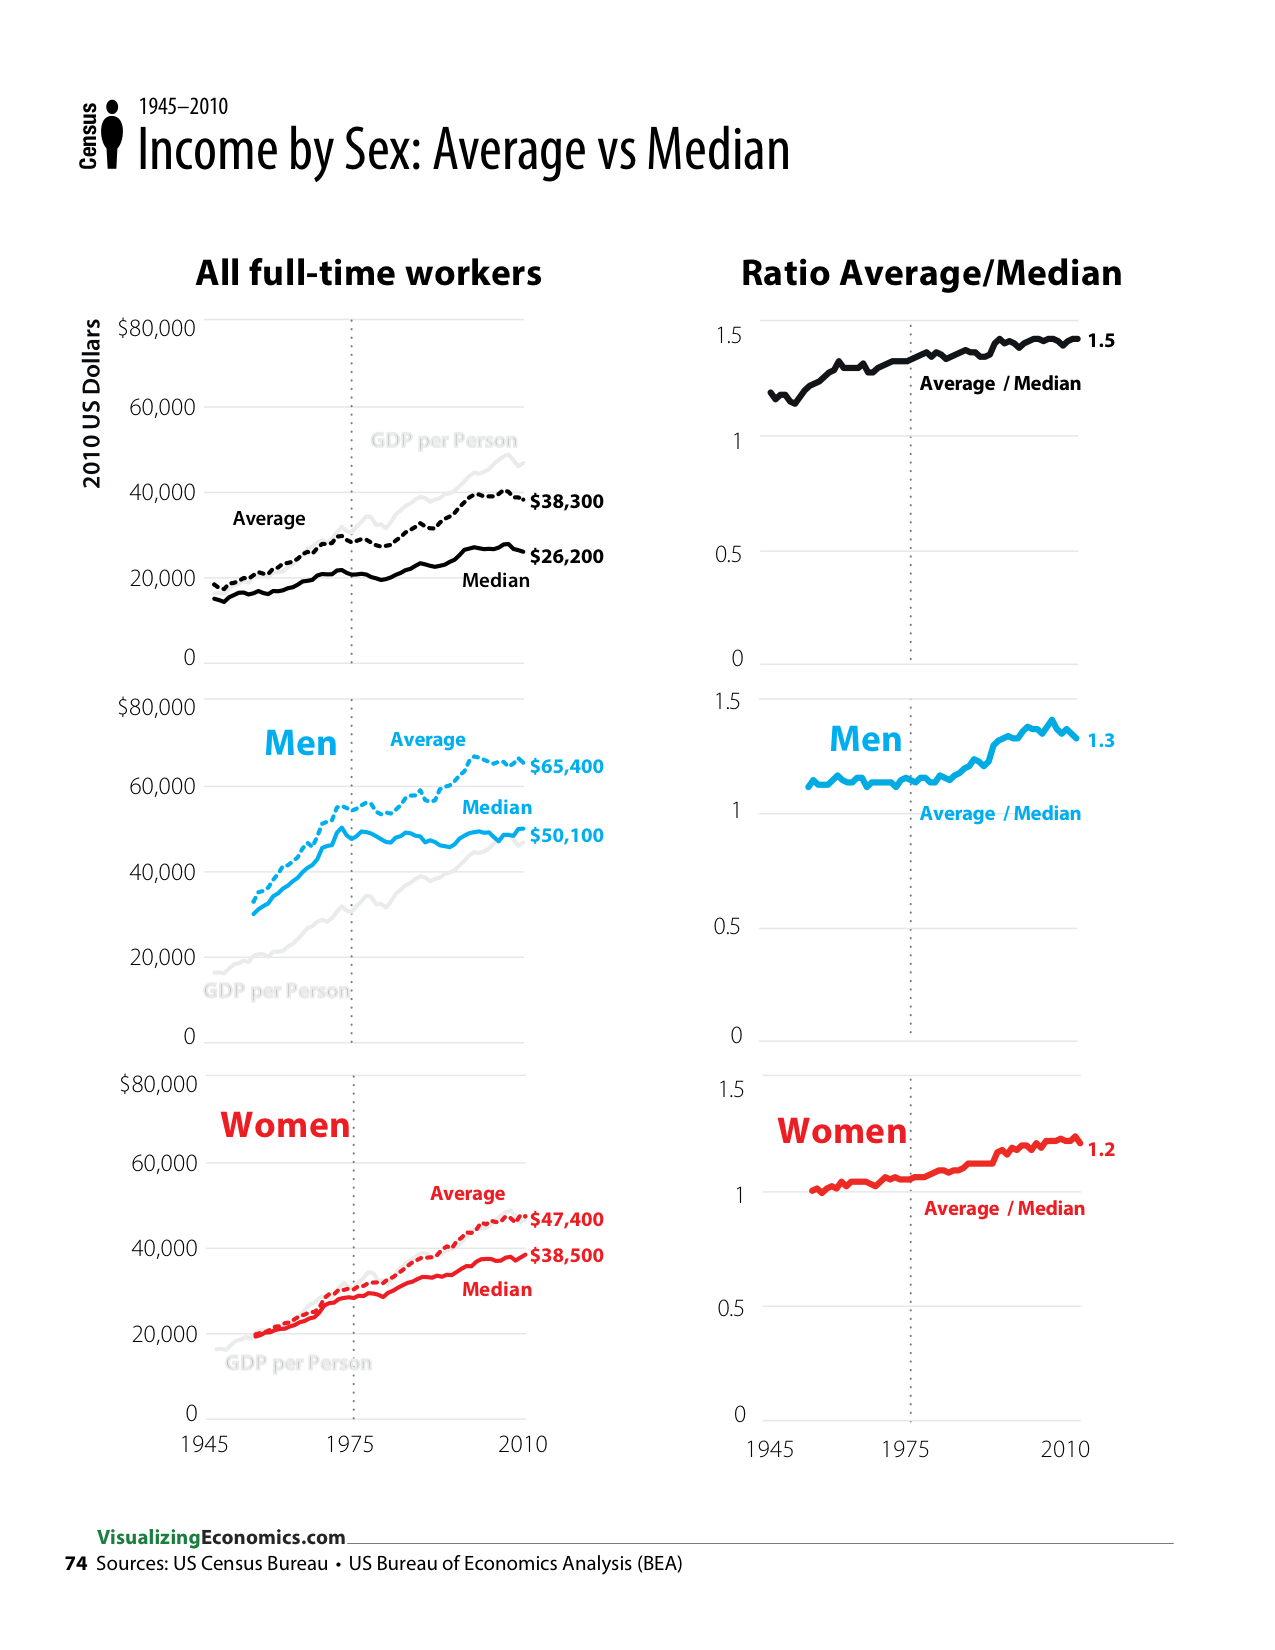
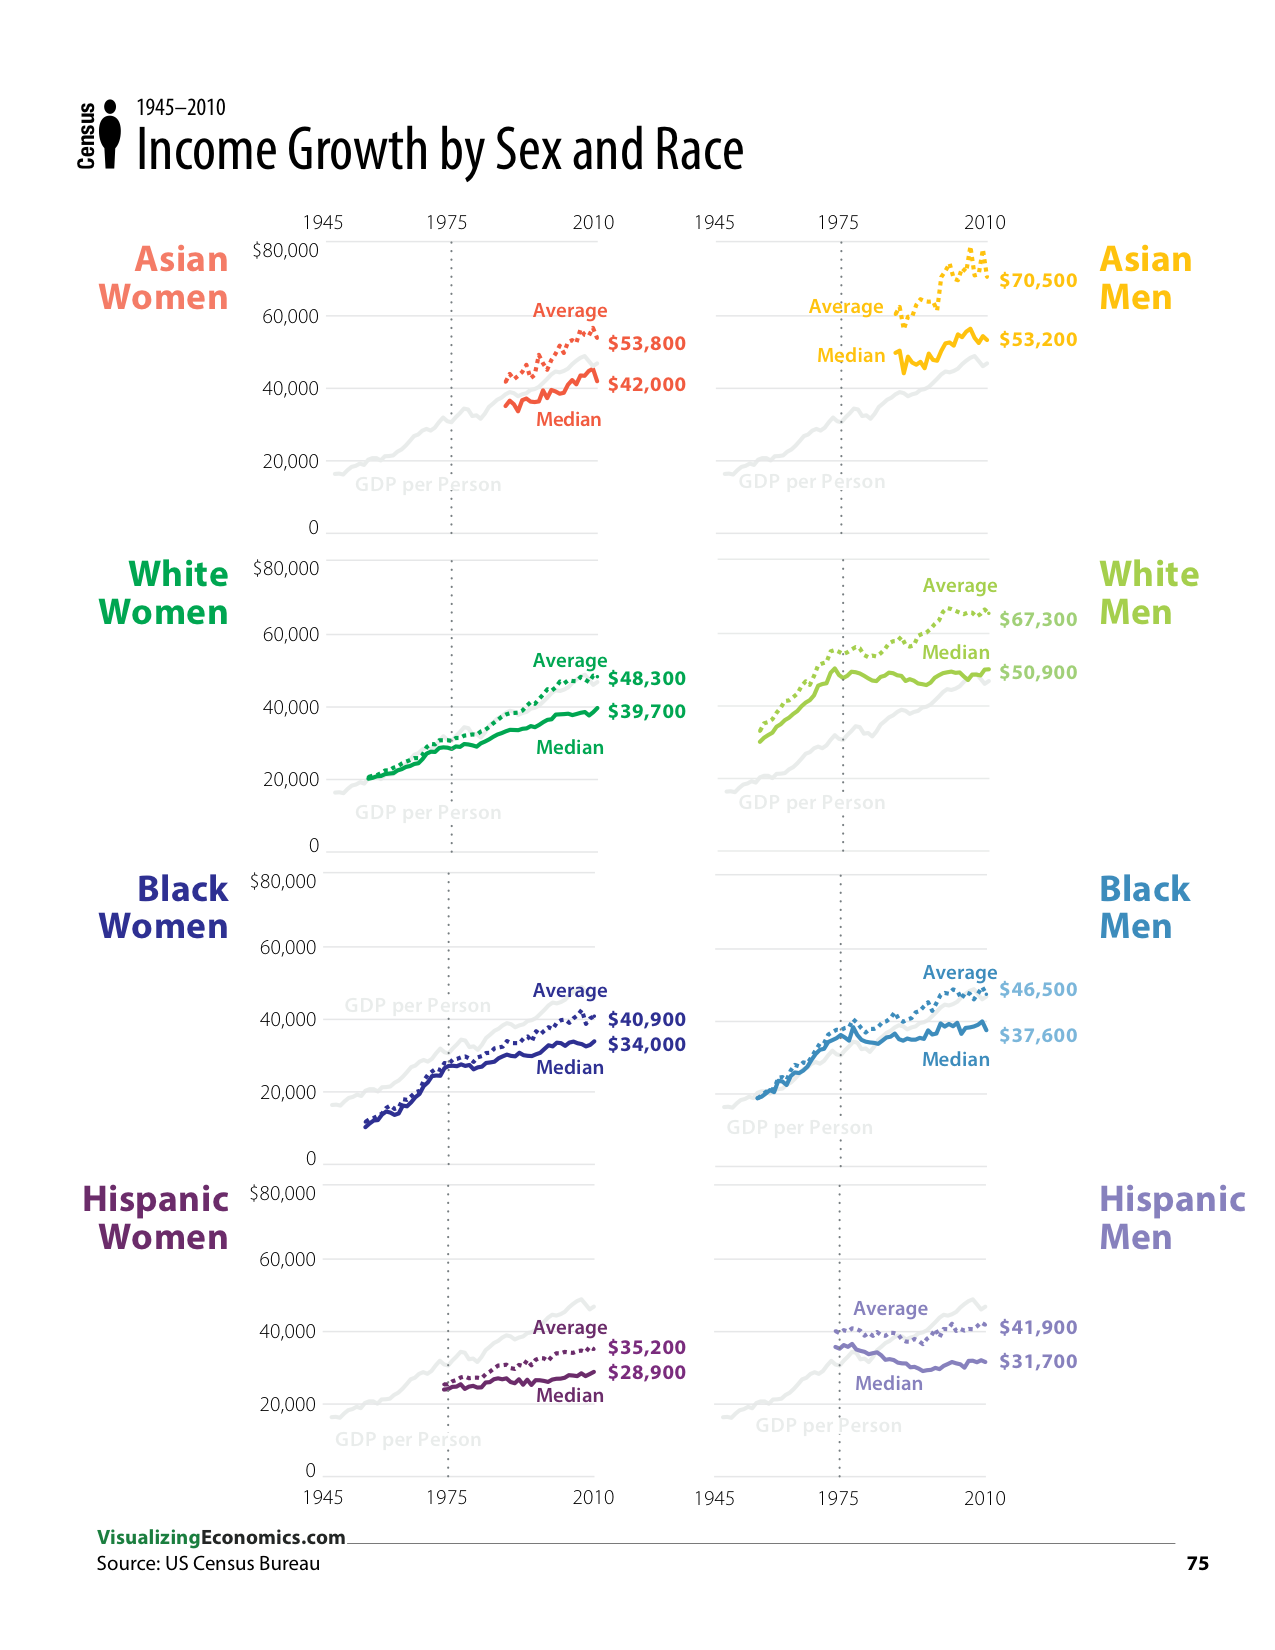
When I took a look at gender, I saw that the average income grew faster than the median for both men and women. However, for men, this divergence of average and median income started after the late-1970s, when their median income growth flatten (similar to lack of growth in the 1 earner households). However, for women this divergence of average and median income is not as dramatic and can be seen back to the 1950s.

Also interesting was that this pattern (no growth of median income since the late-1970s with continued growth of average income) was very clear in their chart for white men. Especially compared to the other race/sex combinations. 

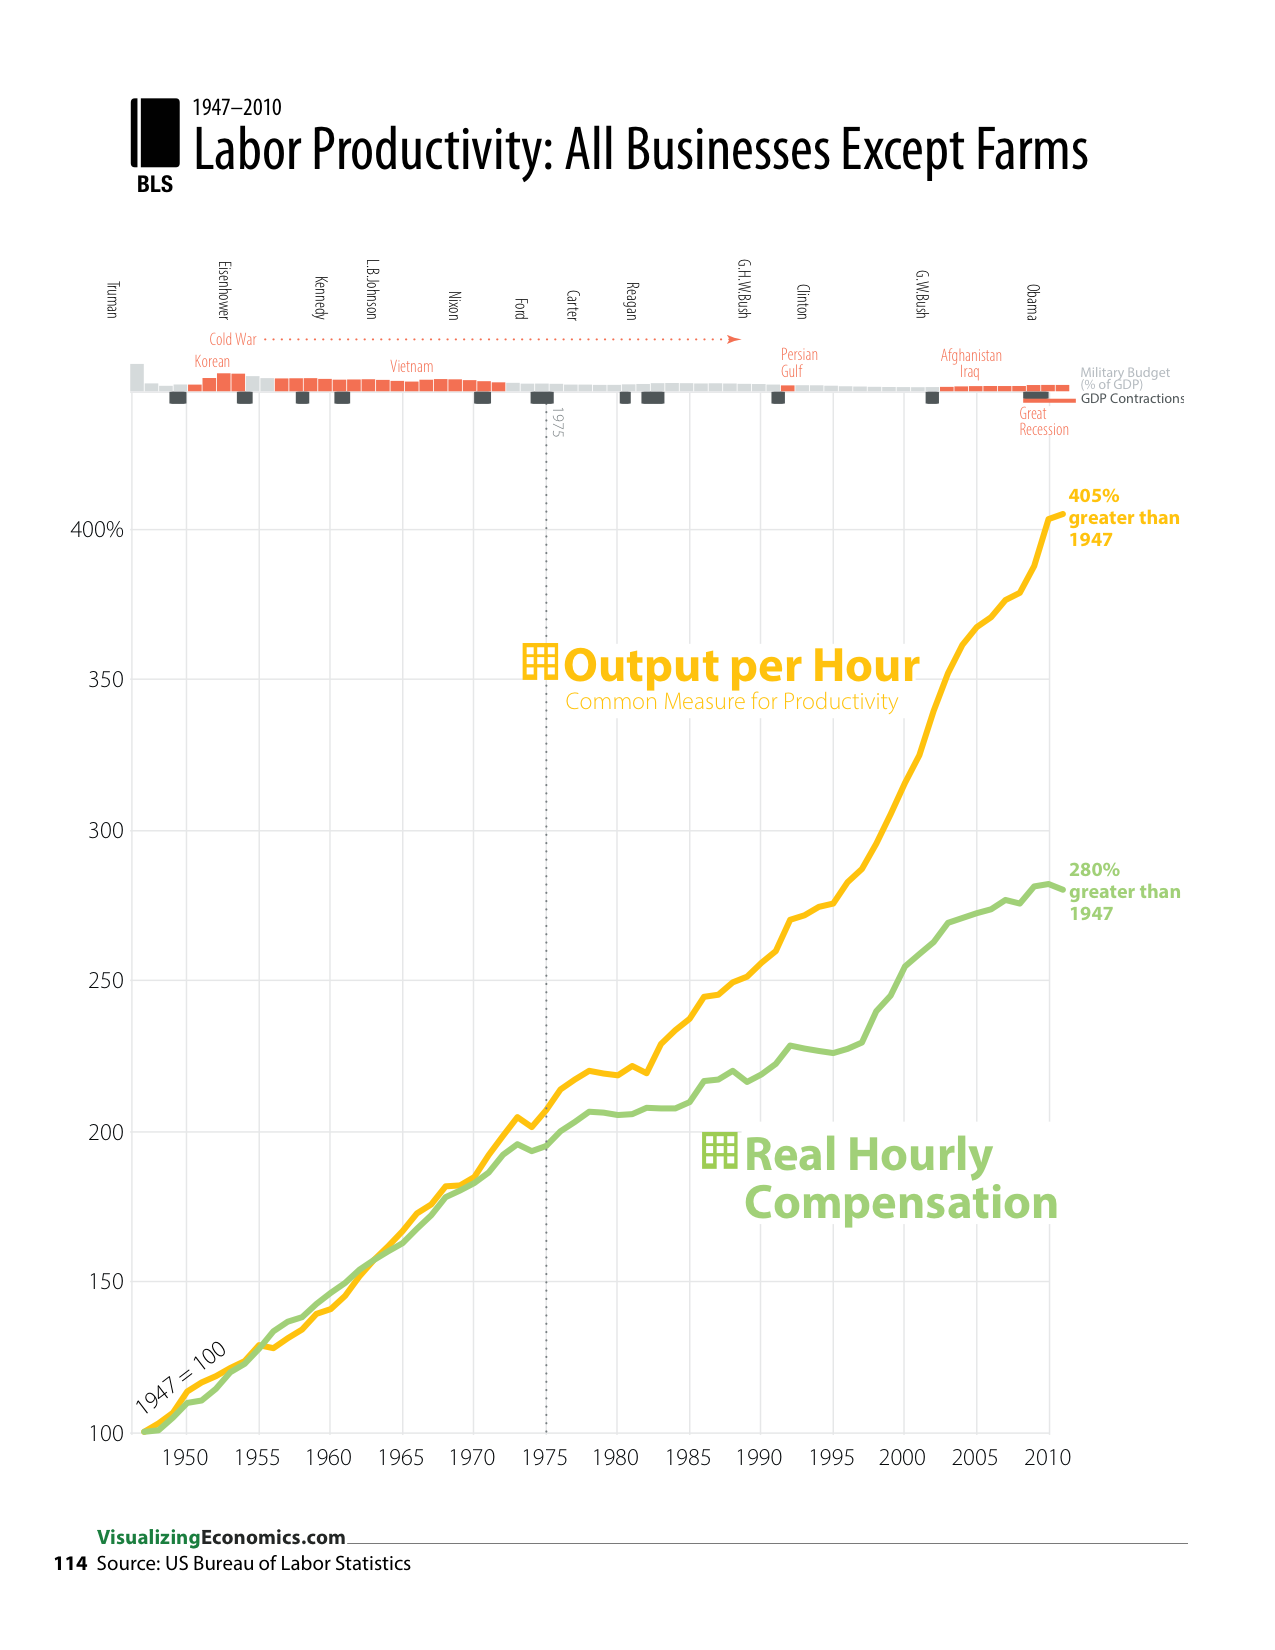
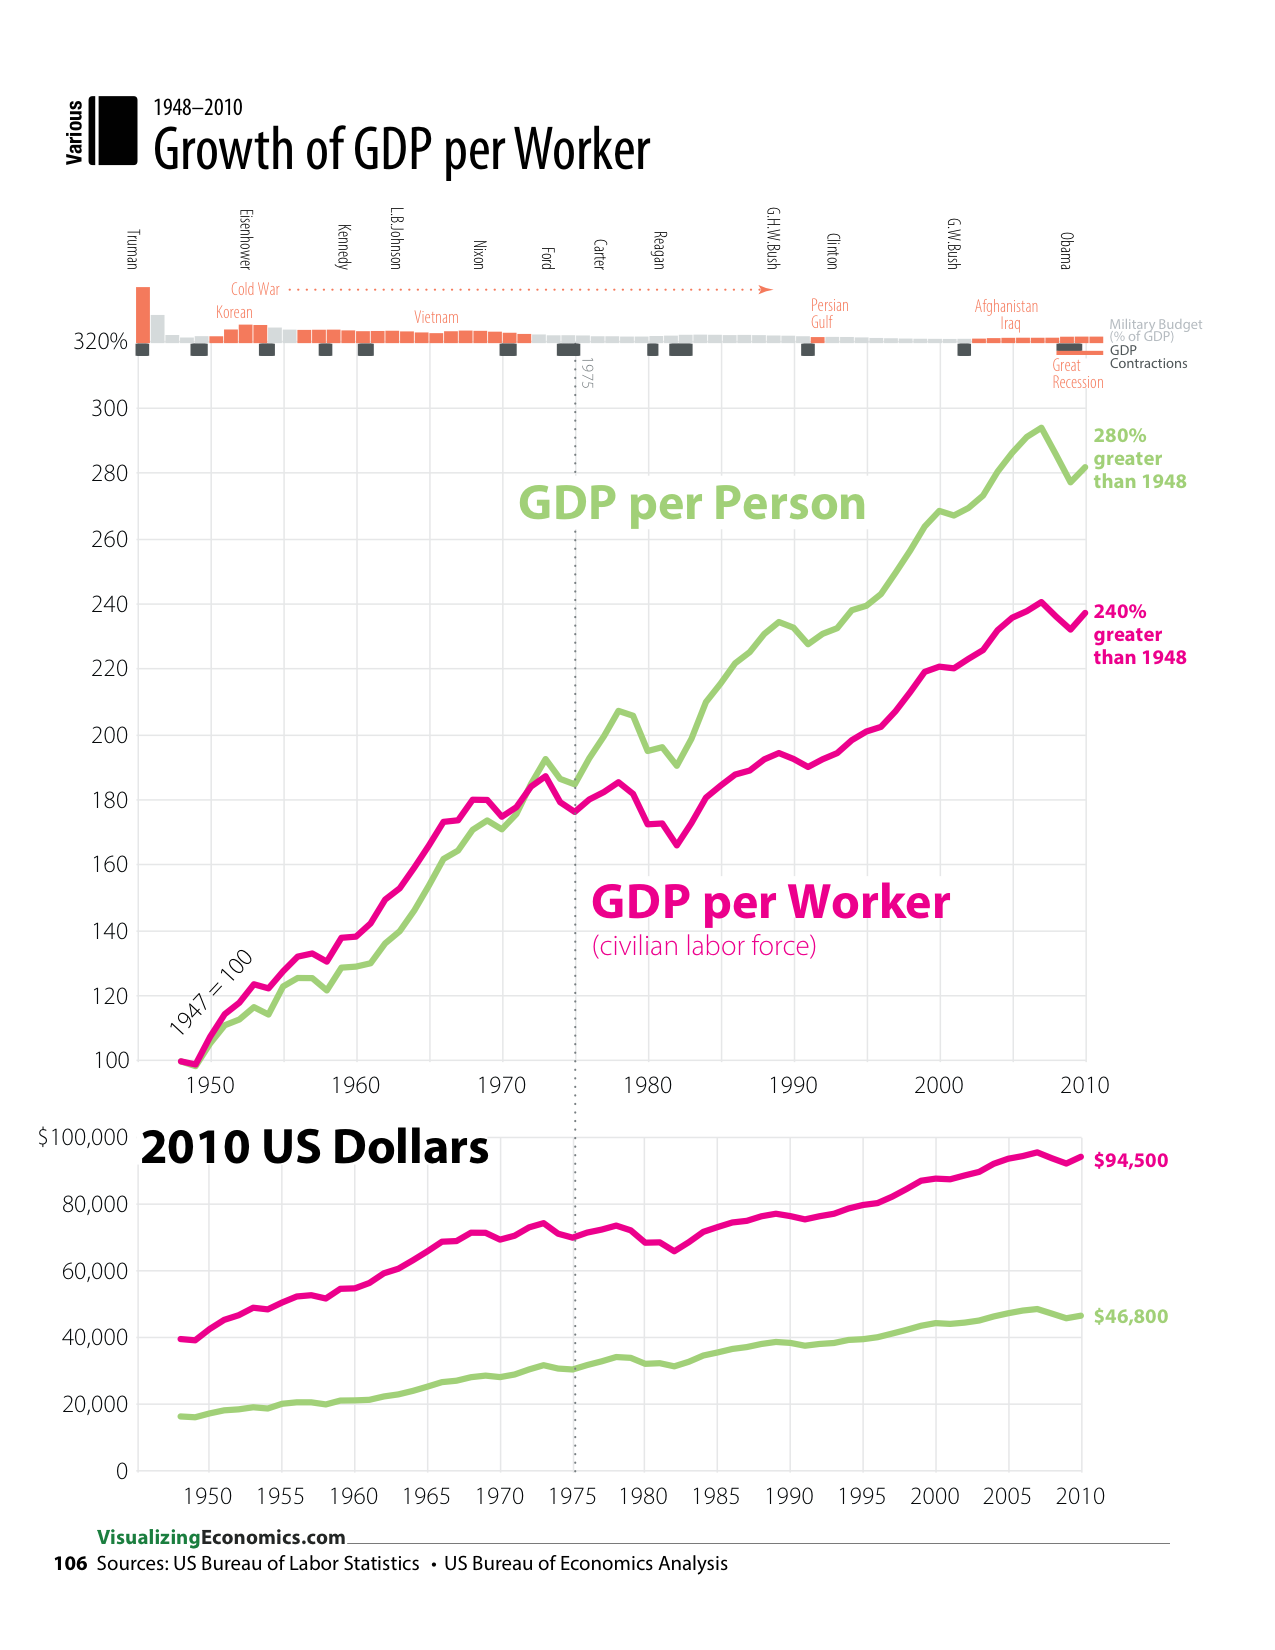
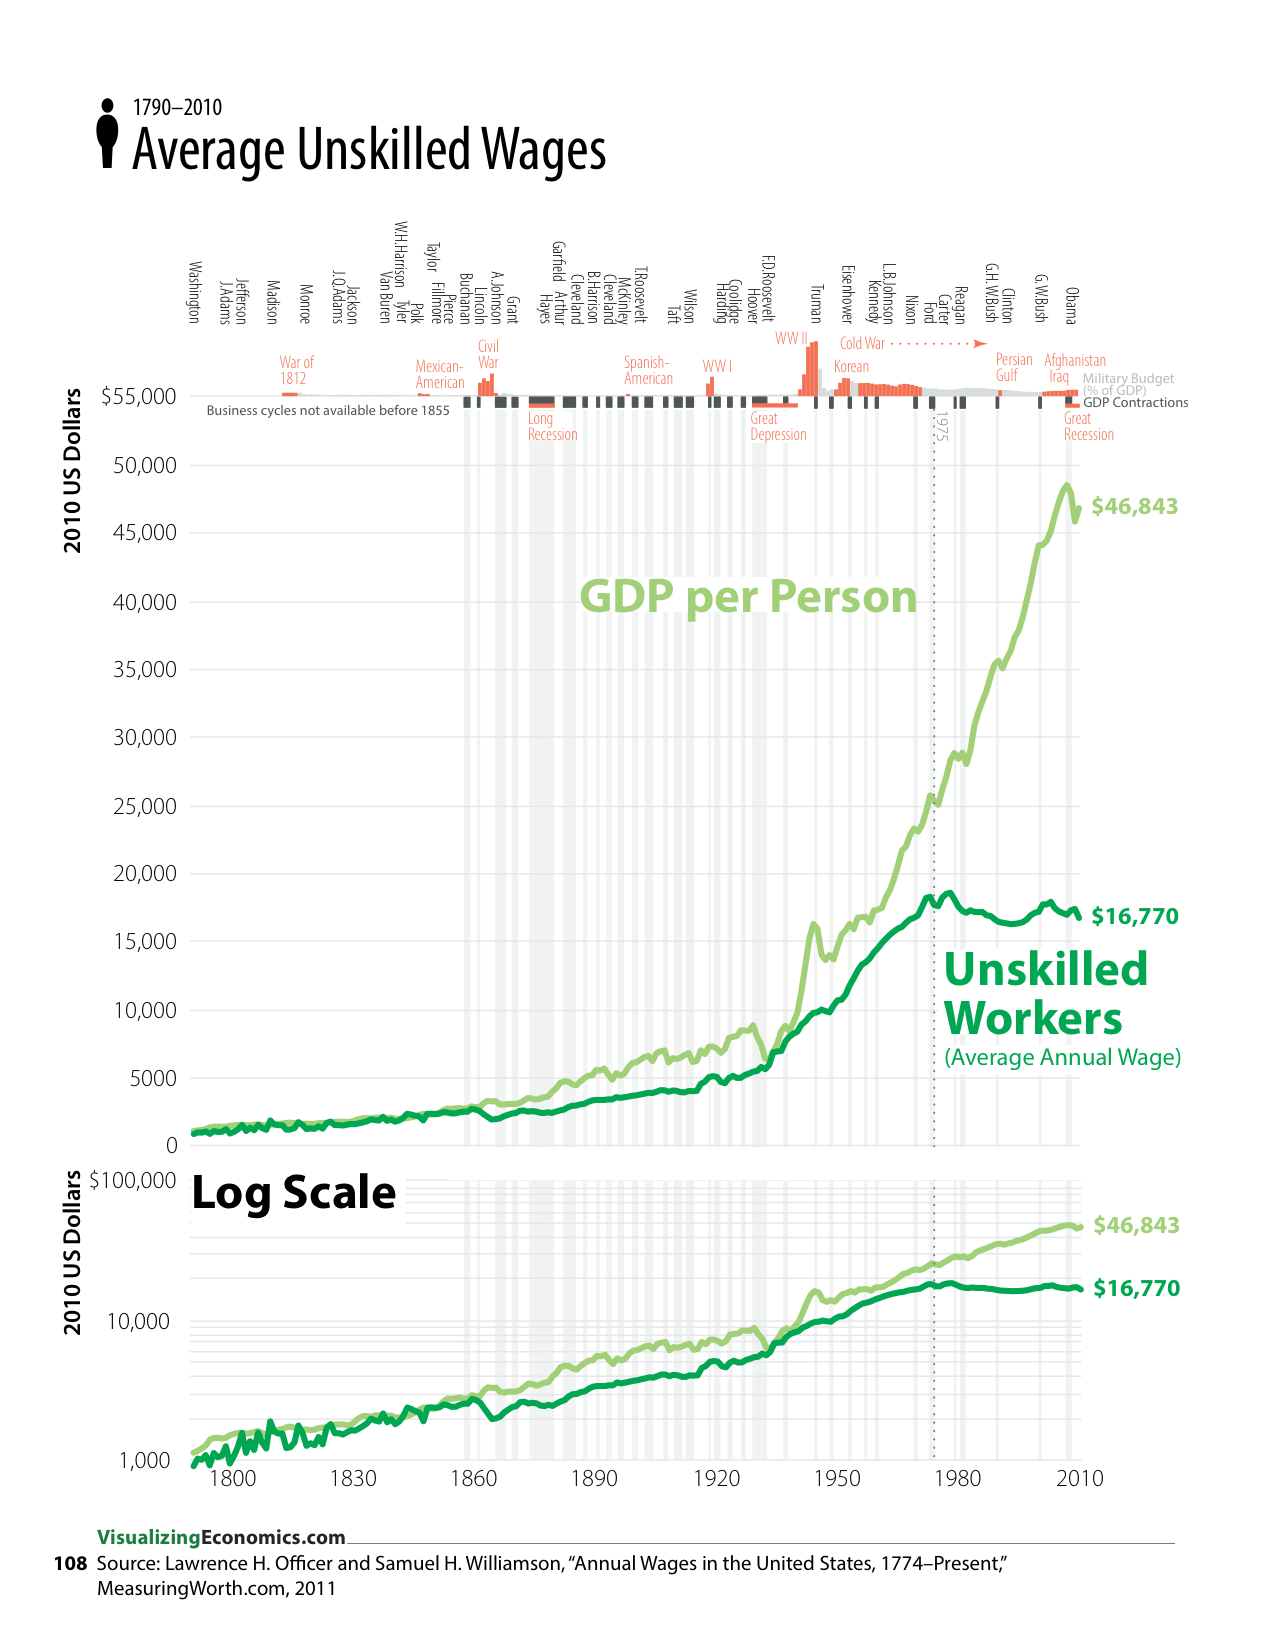
Finally, I saw this visual pattern (a change in the growth rates since the 1970s) when comparing the growth of 

  • GDP per Person vs GDP per Worker
  • GDP per Person vs Average Unskilled Wages 
  • Labor Productivity (Output per Hour) vs Real Hourly Compensation

*Median is the value at which half of the people (or households or tax returns) make less and half make more. This is also referred to as the “50th percentile.”

 Read Online to view all to the graphics from my book.  These graphs were created using OmniGraphSketcher copied into Adobe Illustrator for additional annotations. 

Data from 

Officer, Lawrence H., and Samuel H. Williamson. “Annual Wages in the United States, 1774–Present.” MeasuringWorth.com, 2011. http://www.measuringworth.com/uswage/.

US Census Bureau. “Historical Income Tables: Households.” June 2011. http://www.census.gov/hhes/www/income/data/historical/household/index.html.

US Bureau of Economic Analysis. “Gross Domestic Product (GDP) by Industry Data.” June 2012. http://www.bea.gov/industry/gdpbyind_data.htm.

US Bureau of Labor Statistics


Related Posts Plugin for WordPress, Blogger...

What Happened to Wages?

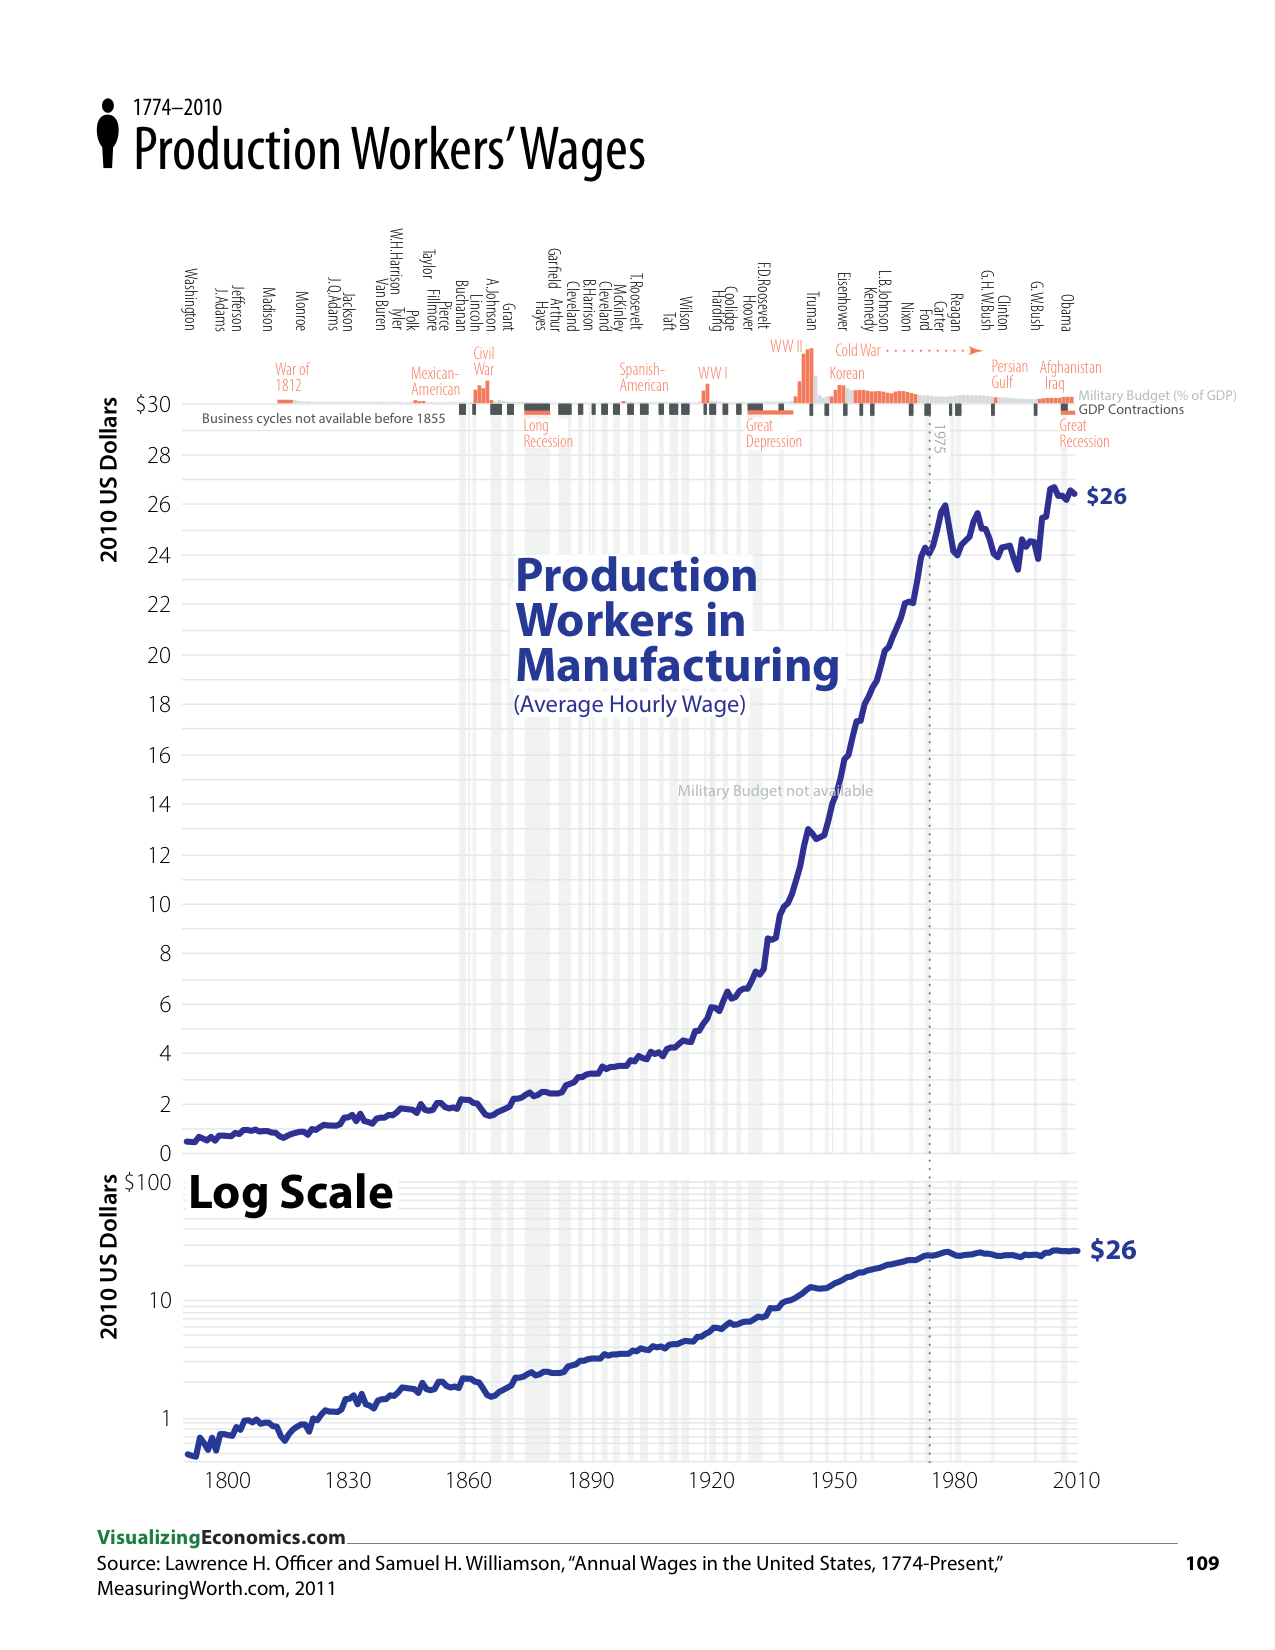
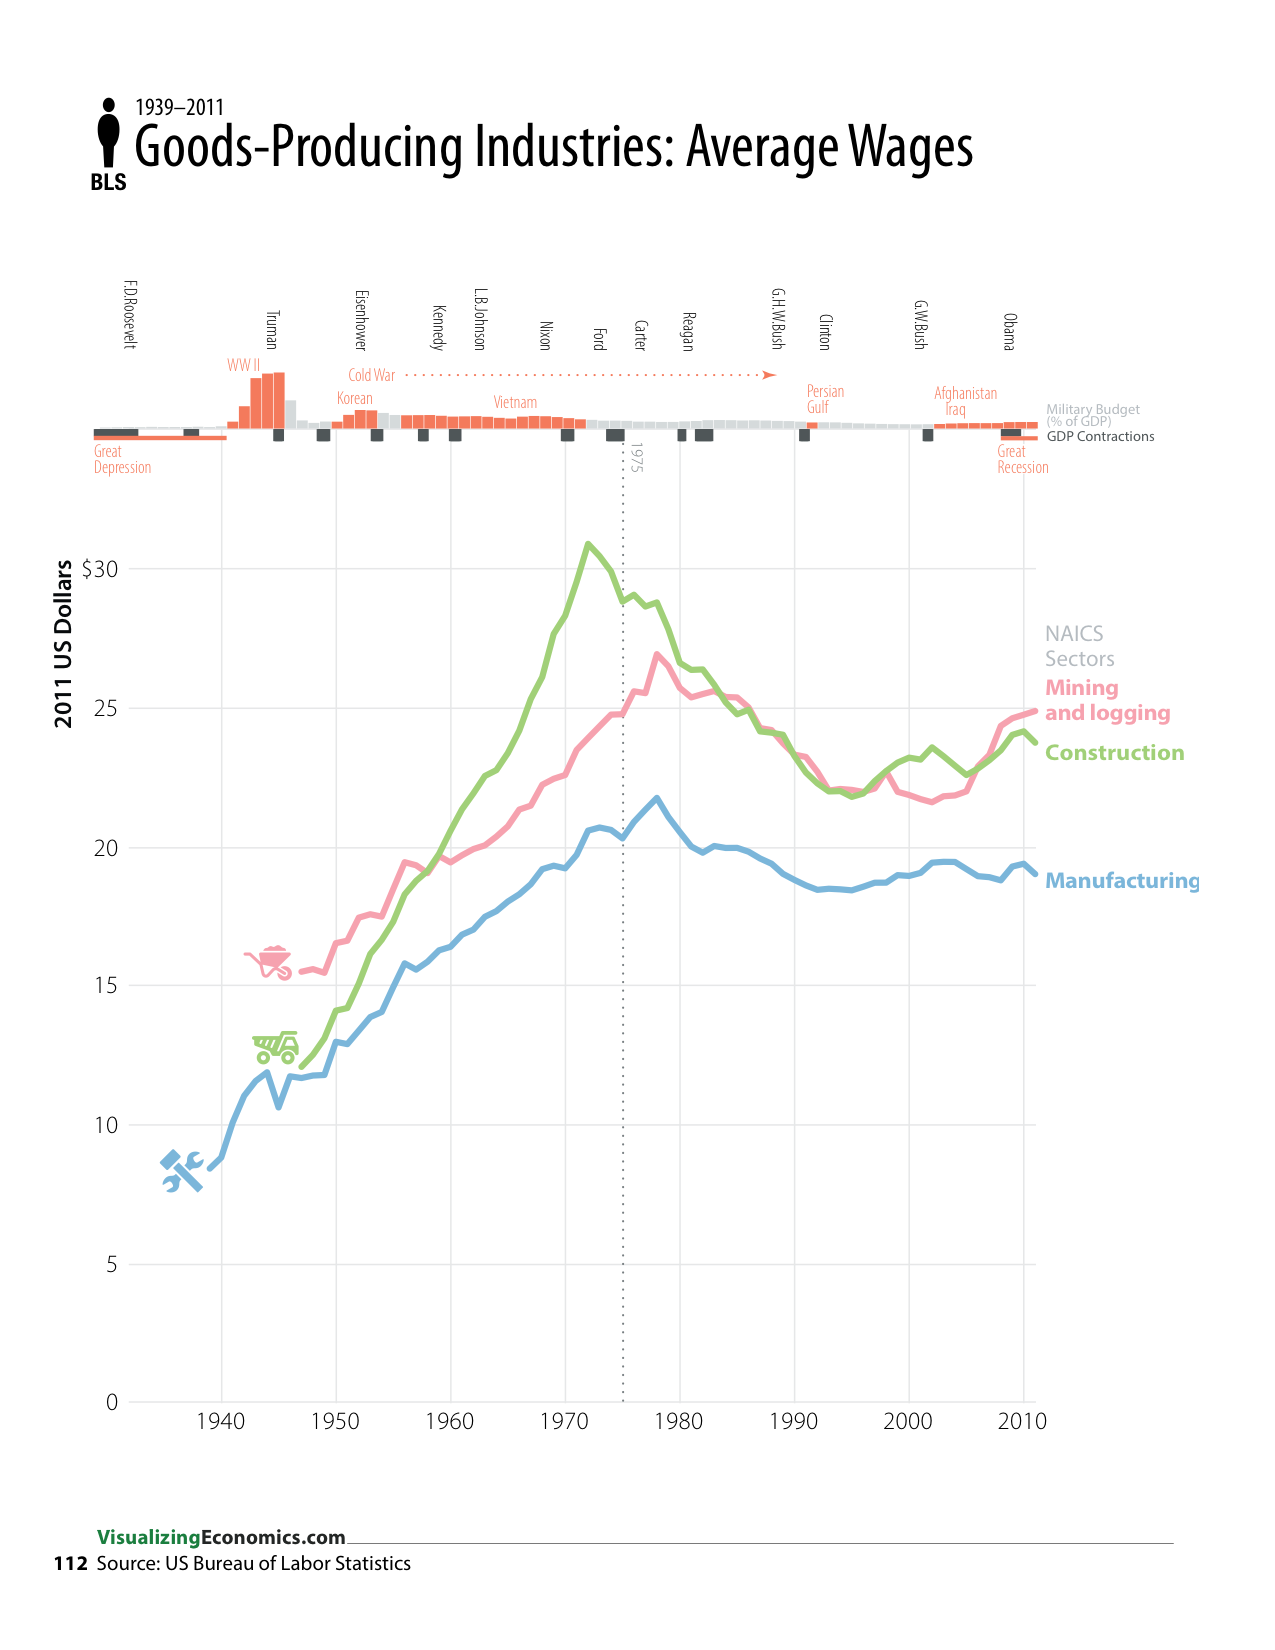
Below are five data graphics from my new book An Illustrated Guide to Income in the United States (pgs 106, 108, 109, 110, 112) that shows the long-term growth in wages in the US.


Click on the images for a closer look. This will open a lightbox the same size as the browser window.

Over the last couple of centuries there has been a steady increase in wages for both unskilled workers...

....and production workers. A lot of this growth is a result of the increases in worker productivity due the industrial revolution of the late 1770s and 1800s. However, over the last 40 years, this long-term growth has stopped or slowed down...

Updated 3/25/13: This Production Workers series includes benefits all the way back to when benefits became measurable in the early 1900s. More detailed definition can be found here.


...even though the GDP per person continues to grow. At the same time, the growth rate of GDP per worker has slowed compared to the overall growth of the economy.

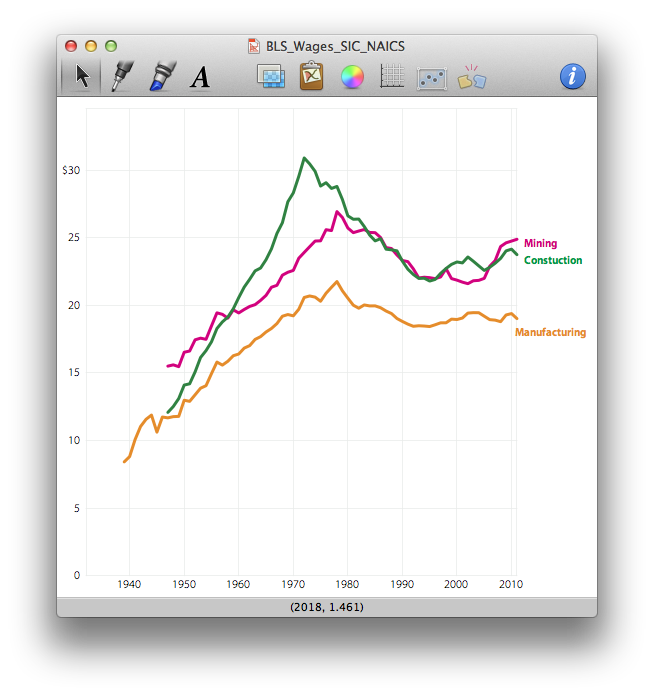
Looking at just goods-producing industries, wages dropped for manufacturing, construction, and mining & logging since their a peak in the 1970s.


But among so-called service industries over the same time period there has been either a dip in wages or no real growth. Exceptions include jobs in the financial industry, education & health services and "other" services (which is mashup of occupations like auto mechanics, pet care, promoting political causes or religious activities). 

Data Sources for Wages (See bibliography for more references)

Officer, Lawrence H., and Samuel H. Williamson. “Annual Wages in the United States, 1774–Present.” MeasuringWorth.com, 2011. http://www.measuringworth.com/uswage/

US Bureau of Labor Statistics. “Table B-8. Average hourly and weekly earnings of production and nonsupervisory employees on private nonfarm payrolls by industry sector, seasonally adjusted.” November 2012. http://www.bls.gov/webapps/legacy/cesbtab8.htm


Designer's Notes: Some of my thoughts on the design and the approaches I used. 

Related Posts Plugin for WordPress, Blogger...

Average Tax Rates up to $400,000 for Single Filers: 2009

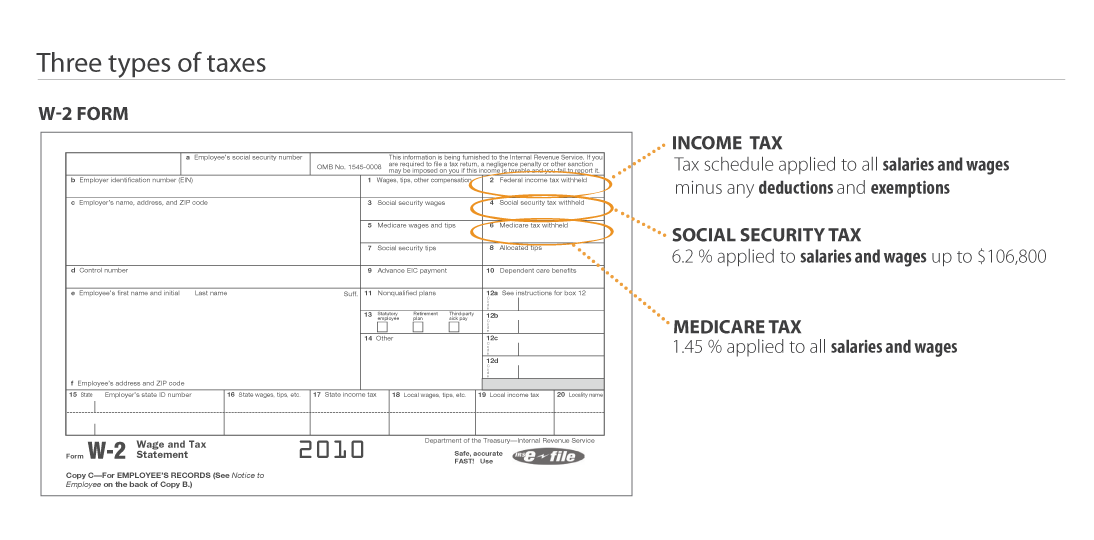
UPDATE 3/17/2010: I added more information about marginal tax rates by graphing the combined marginal tax rate line in the last graph. Also clarified that the employer-side of the payroll taxes are not included The first of series of infographics I am designing to illustrate the average federal tax rate applied to different salaries. I want to show how the marginal income tax rates + social security and medicare taxes combine together for a single taxpayer up to $400,000. (This graphic does not include payroll taxes paid by the employer.)

A little background about this data. If you take a look at your W-2 form you can see that there are 3 different taxes applied to salaries and wages:

The income tax graph is created from the 2009 tax schedule for a single taxpayer:

which you can find from the IRS Tax Tables here while the information about the social security and medicare tax can be found here.

Related Posts Plugin for WordPress, Blogger...

Has Middle America's Wages Stagnated?

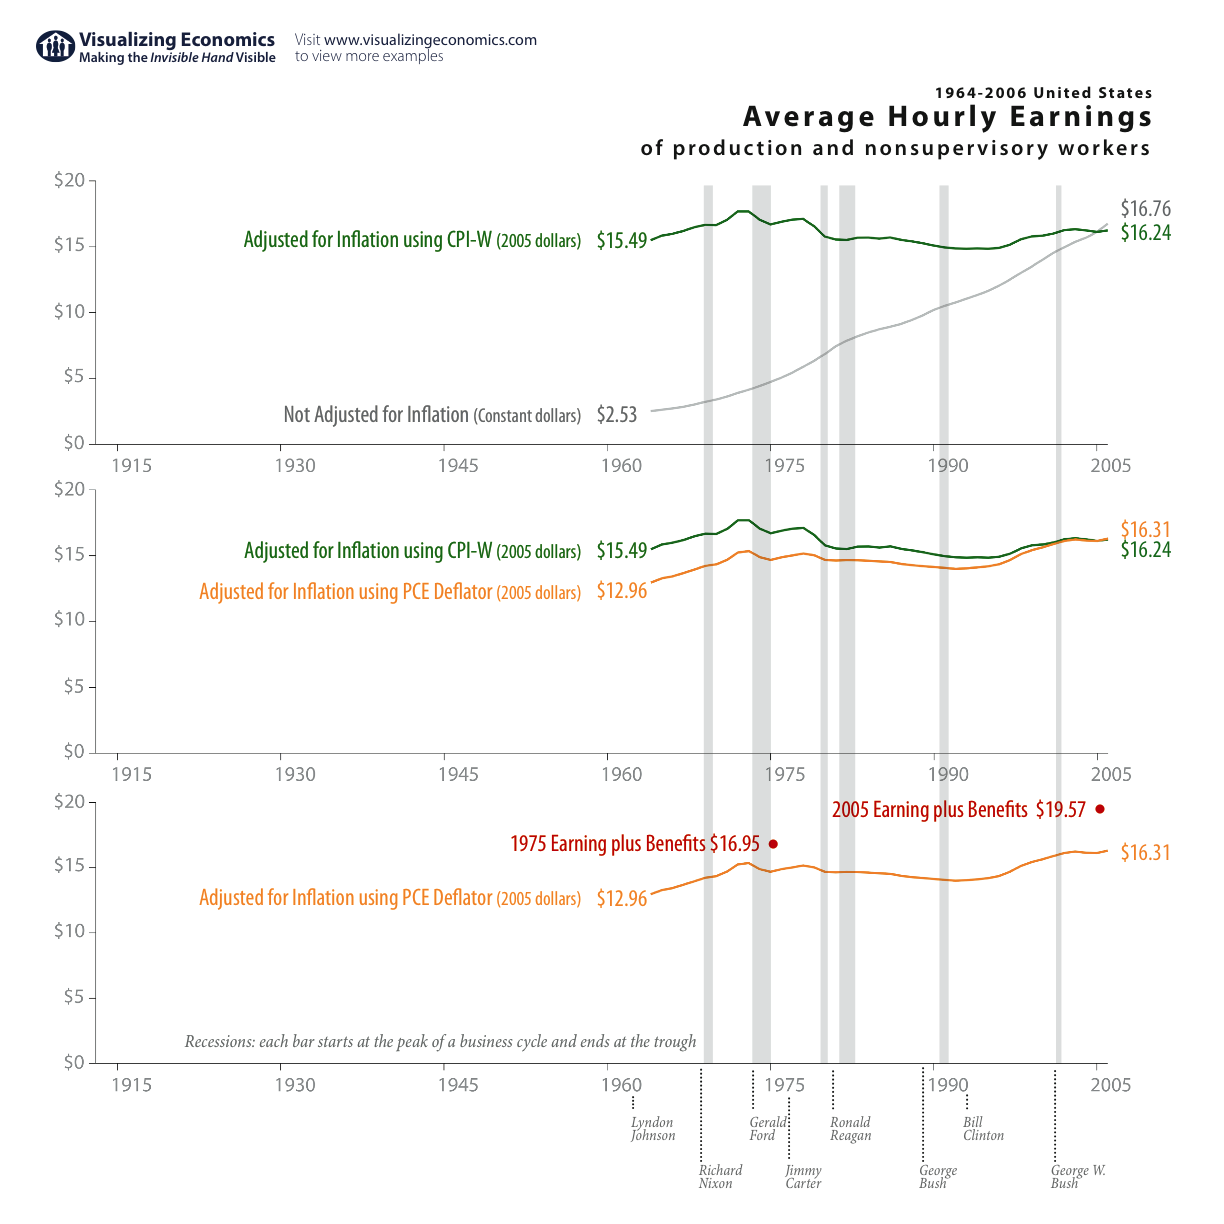
Avg Hourly Earnings

I found a Federal Reserve article that analyzed the change in Average Hourly Earnings for production and nonsupervisory workers. After adjusting for inflation using the Personal consumption expenditures (PCE) {instead of the Consumer Price Index-Urban Wage Earners and Clerical Workers (CPI-W)} and including an estimate for worker's benefits, the author concluded that workers' hourly earnings (wages plus benefits) actually increased by 16% over 30 years (1975-2005) rather than decreased. Here, I graphed the full history, 1964-2006, but used the approach laid out in the article to show the effect of inflation and benefits. BTW, if you earned $16.76 an hour in 2006 that gave you an annual income of $33,520 (assuming you worked full-time).

See also:Average Income in the United StatesTotal Income of Top, Middle, & Bottom

Addendum: This was passed on to me from a reader who found it on Marginal Revolution

Related Posts Plugin for WordPress, Blogger...

Real Gross National Income per Person

Gni per Capita Graph

A NYT article about the .01 Percent had a quote from Warren Buffet that caught my attention: "'This is a significantly richer country than 10, 20, 30, 40, 50 years ago,' he declared, backing his assertion with a favorite statistic. The national income, divided by the population, is a very abundant $45,000 per capita, he said, a number that reflects an affluent nation but also obscures the lopsided income distribution intertwined with the prosperity." This graph was an attempt to visualize that statistic. (Keep in mind that the numbers are in 2000 US$) {Click on the graph to take a closer look}

The US Gross National Income (GNI) represents the total buying power of citizens of the United States. This buying power can be transferred around the economy by taxation and lending. GNI includes Wages and Salaries + Rents + Interest + Profits (also includes Depreciation of Capital + Sales taxes - Subsidies). Since it is "National" it measures income from resources owned by the citizens of the United States, regardless where the production occurs. Gross national income is identical to gross national product (GNP).

The Real GNI data can be found at Bureau of Economic Analysis National Economic Accounts Table 1.7.6. Population data can be found at Census Historical Series and Census Current Estimates .

Related Posts Plugin for WordPress, Blogger...