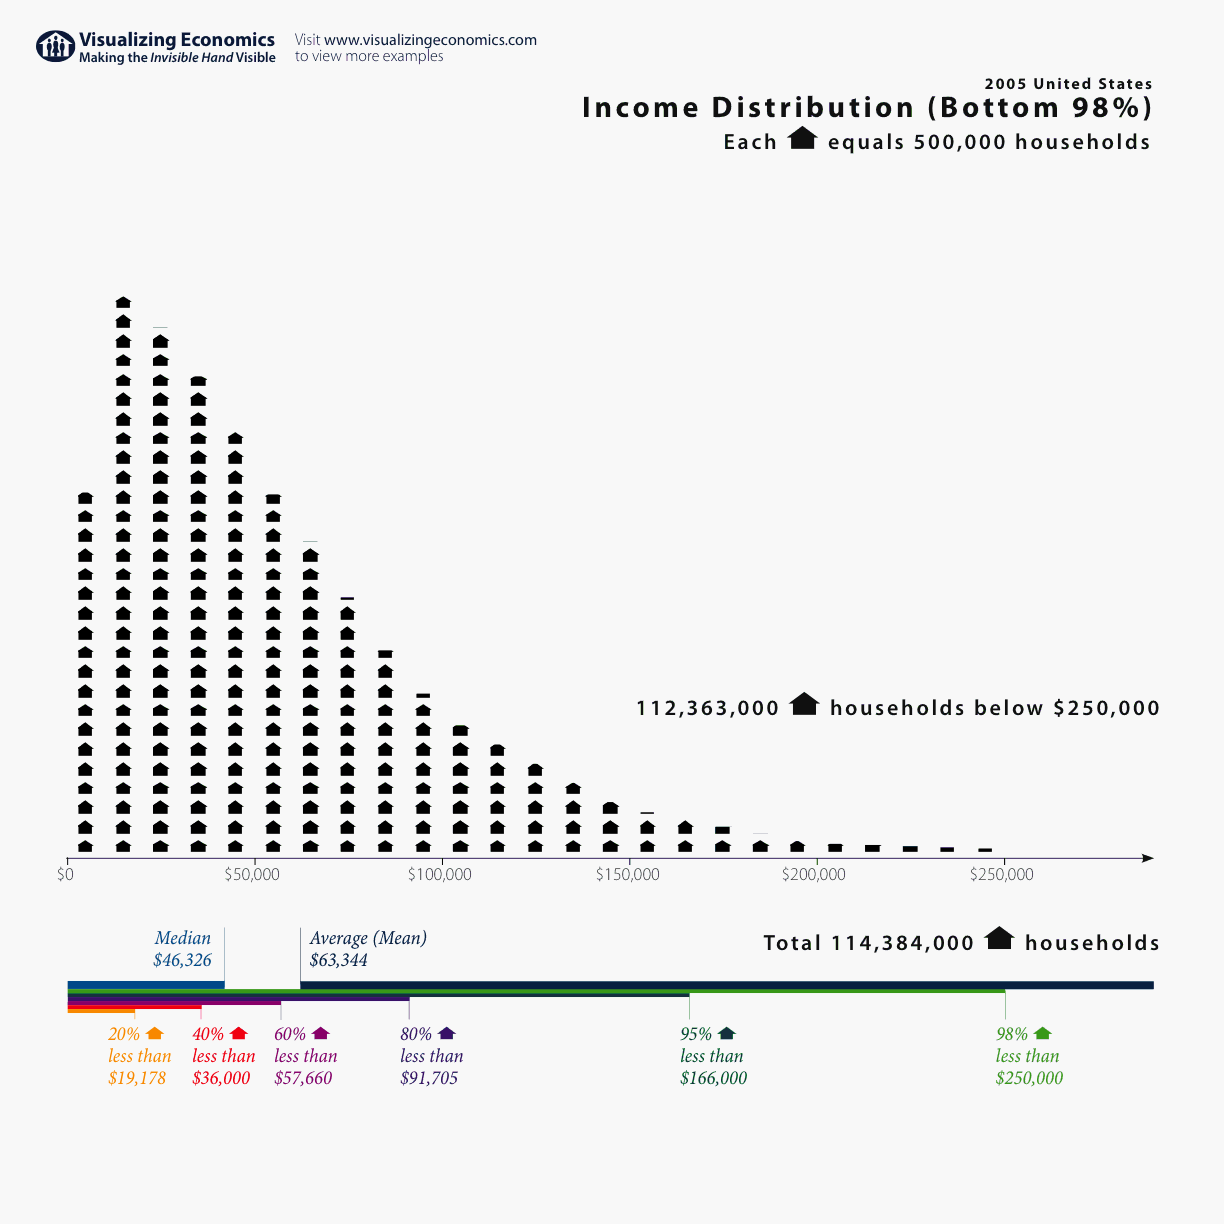
More Census data! This time it is the U.S. income distribution for 2005 showing the number of households up to $250,000. (I have since added more graphs that include incomes above $250,000: 2005 US Income Distribution Part 2 and 2005 US Income Distribution Part 3) {Click on the graph to take a closer look}
While the original Census data can be found in U.S. Census Bureau's Current Population Survey Table HINC-06. Income Distribution to $250,000 or More for Households I needed to calculate the number of households in $10,000 increments for this graph. (That calculation can be found here: Census household income distribution. Besides the income distribution for 2005, I added 2004 as a bonus. It can be viewed by anyone with a Google Account.) See Also:2005 US Income Distribution Part 2 and 2005 US Income Distribution Part 3 for graphs of the rich and super rich. And United States' Average Income since 1913 both with and without capital gains. Addendum: 11/19/2006 Added upper limits of income quintiles and the median from Table H-1. Income Limits for Each Fifth and Top 5 Percent of Households [tags]US Income Distribution, Income Distribution, Census Income Distribution[/tags]

