
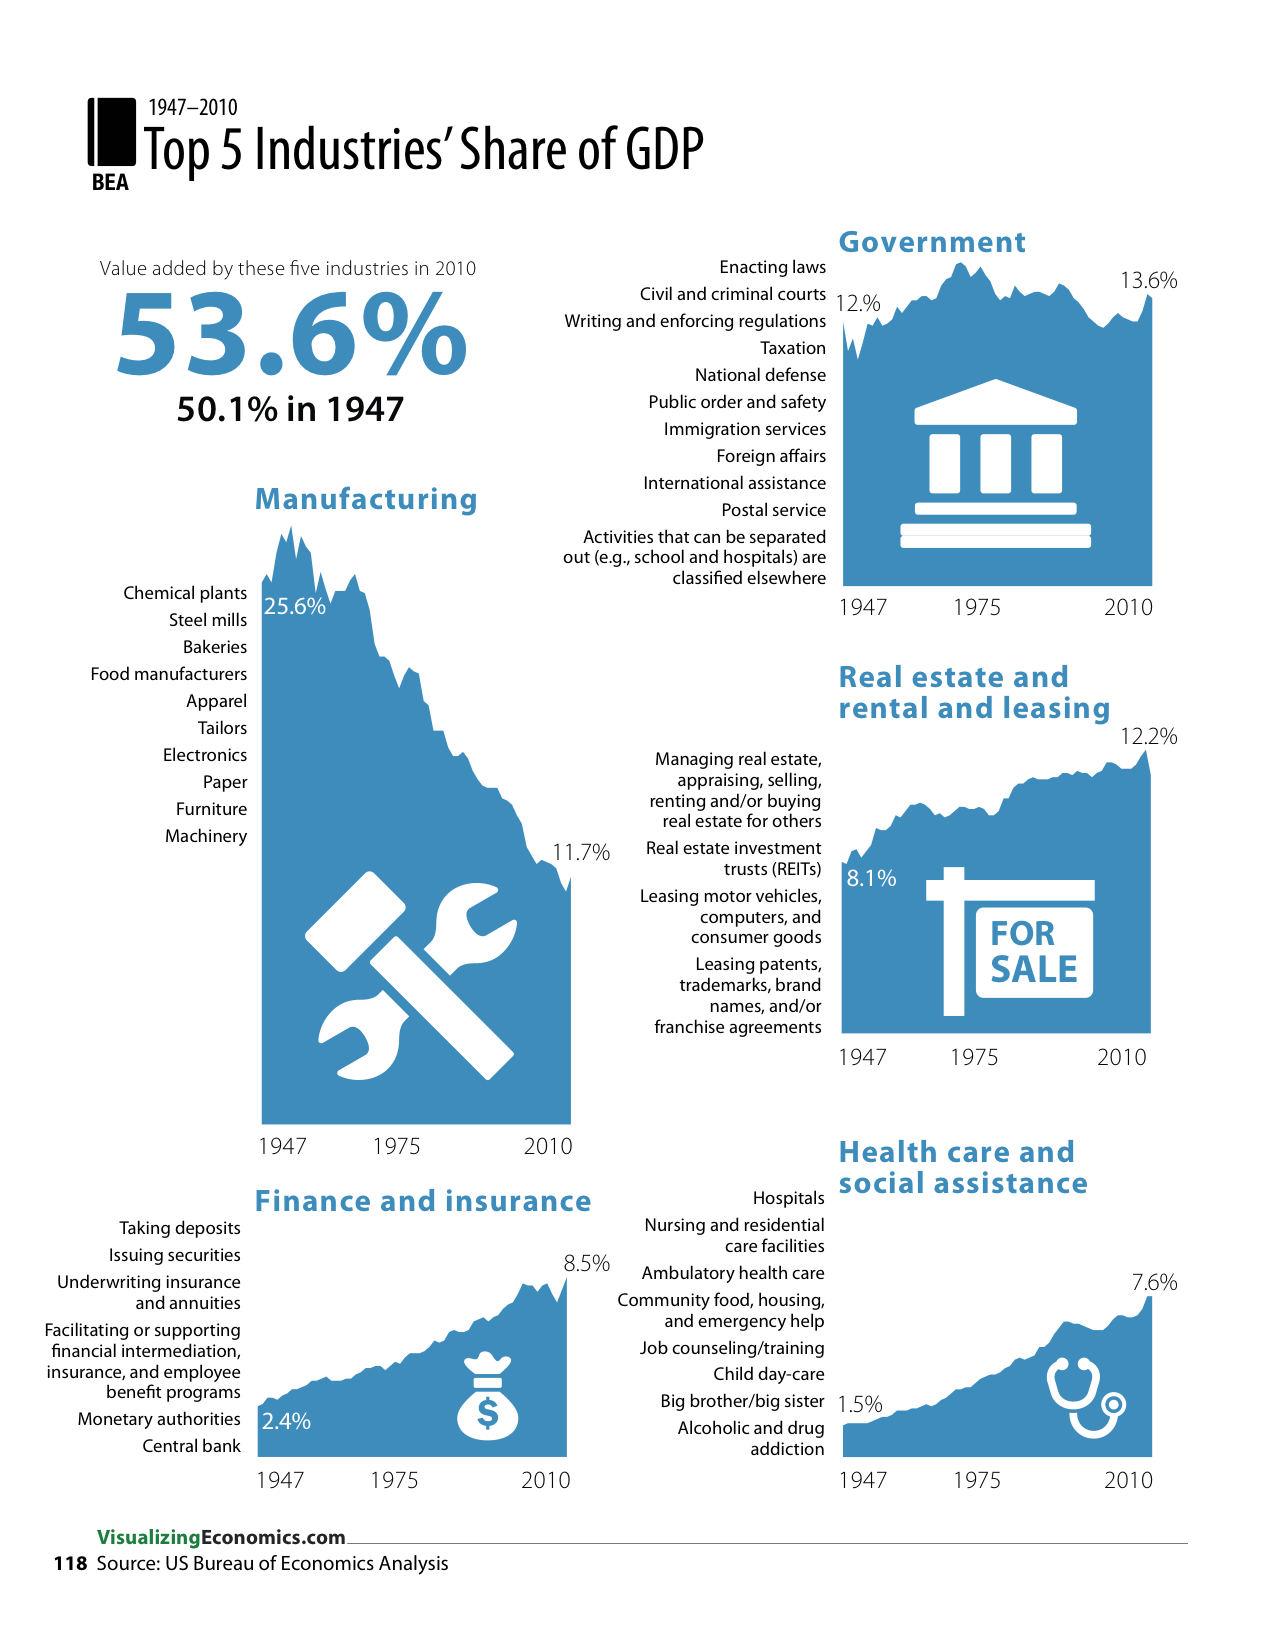
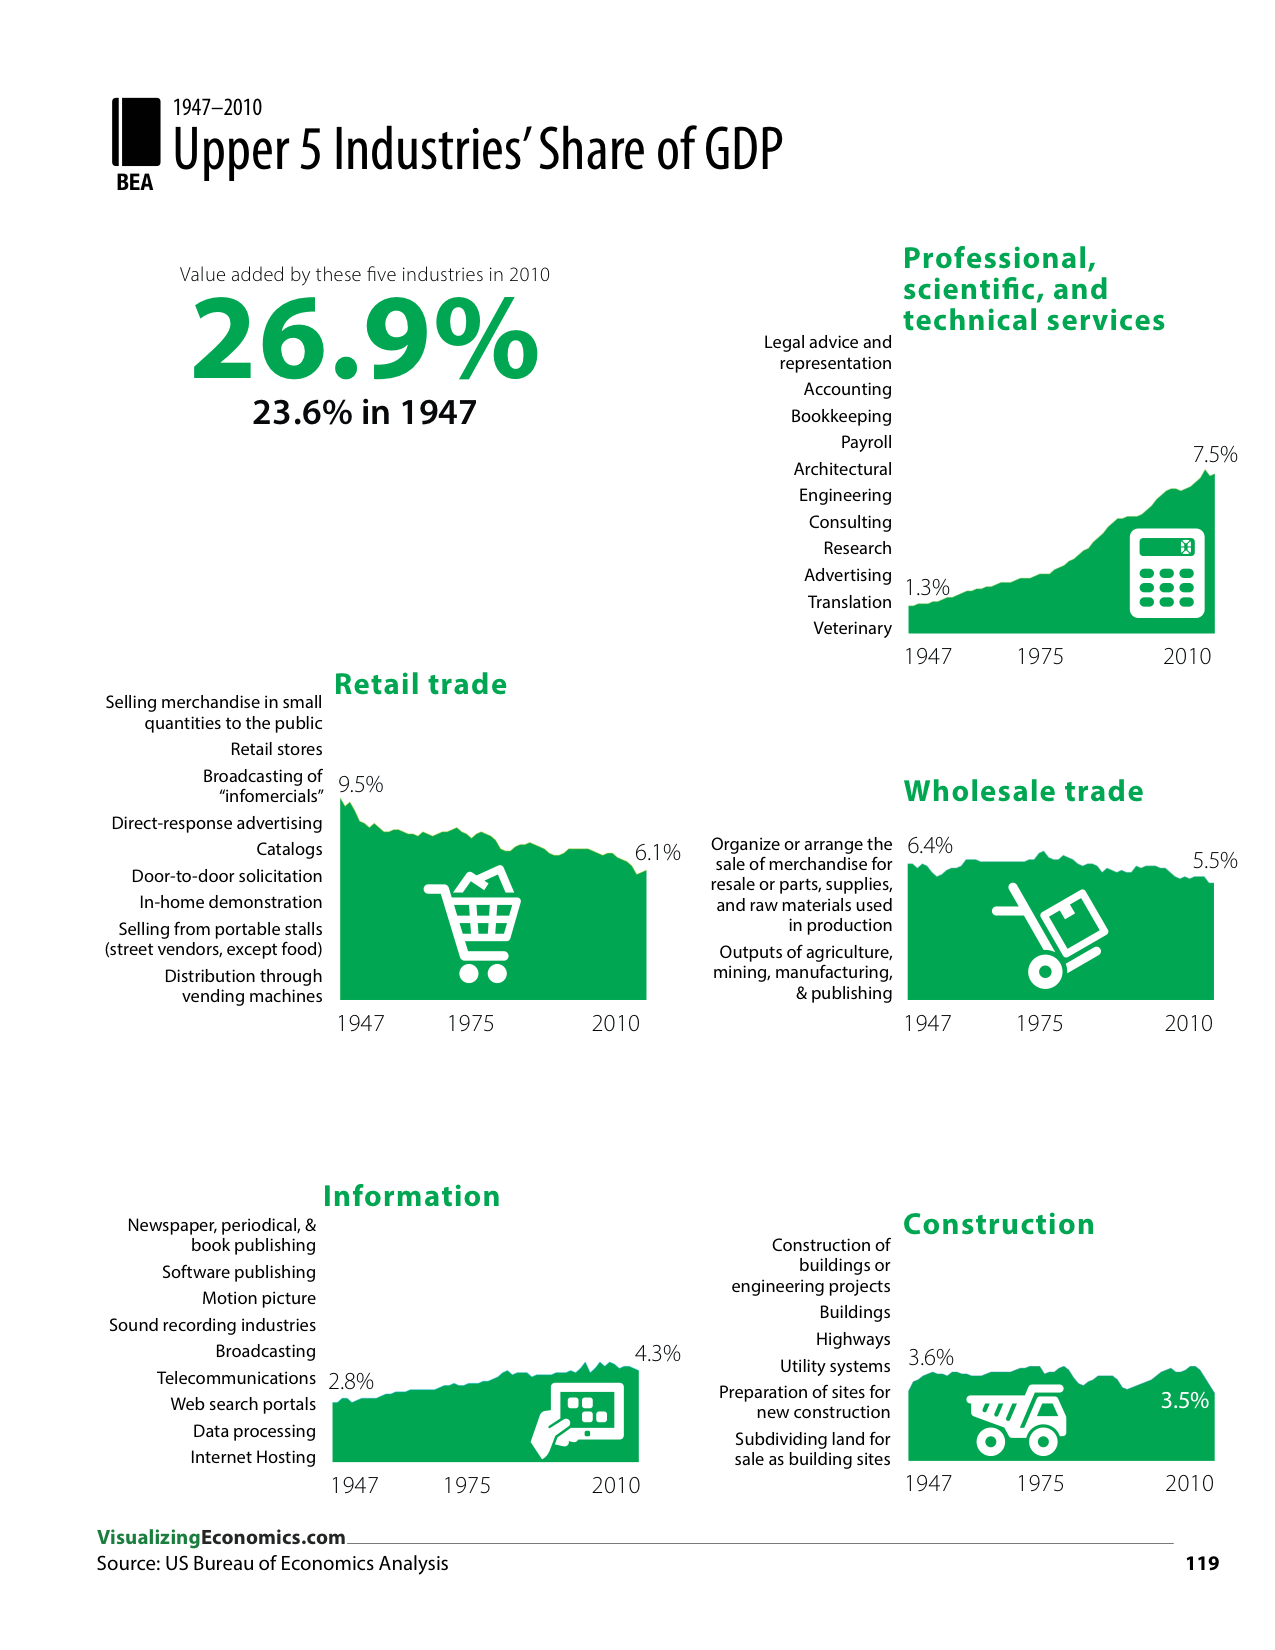
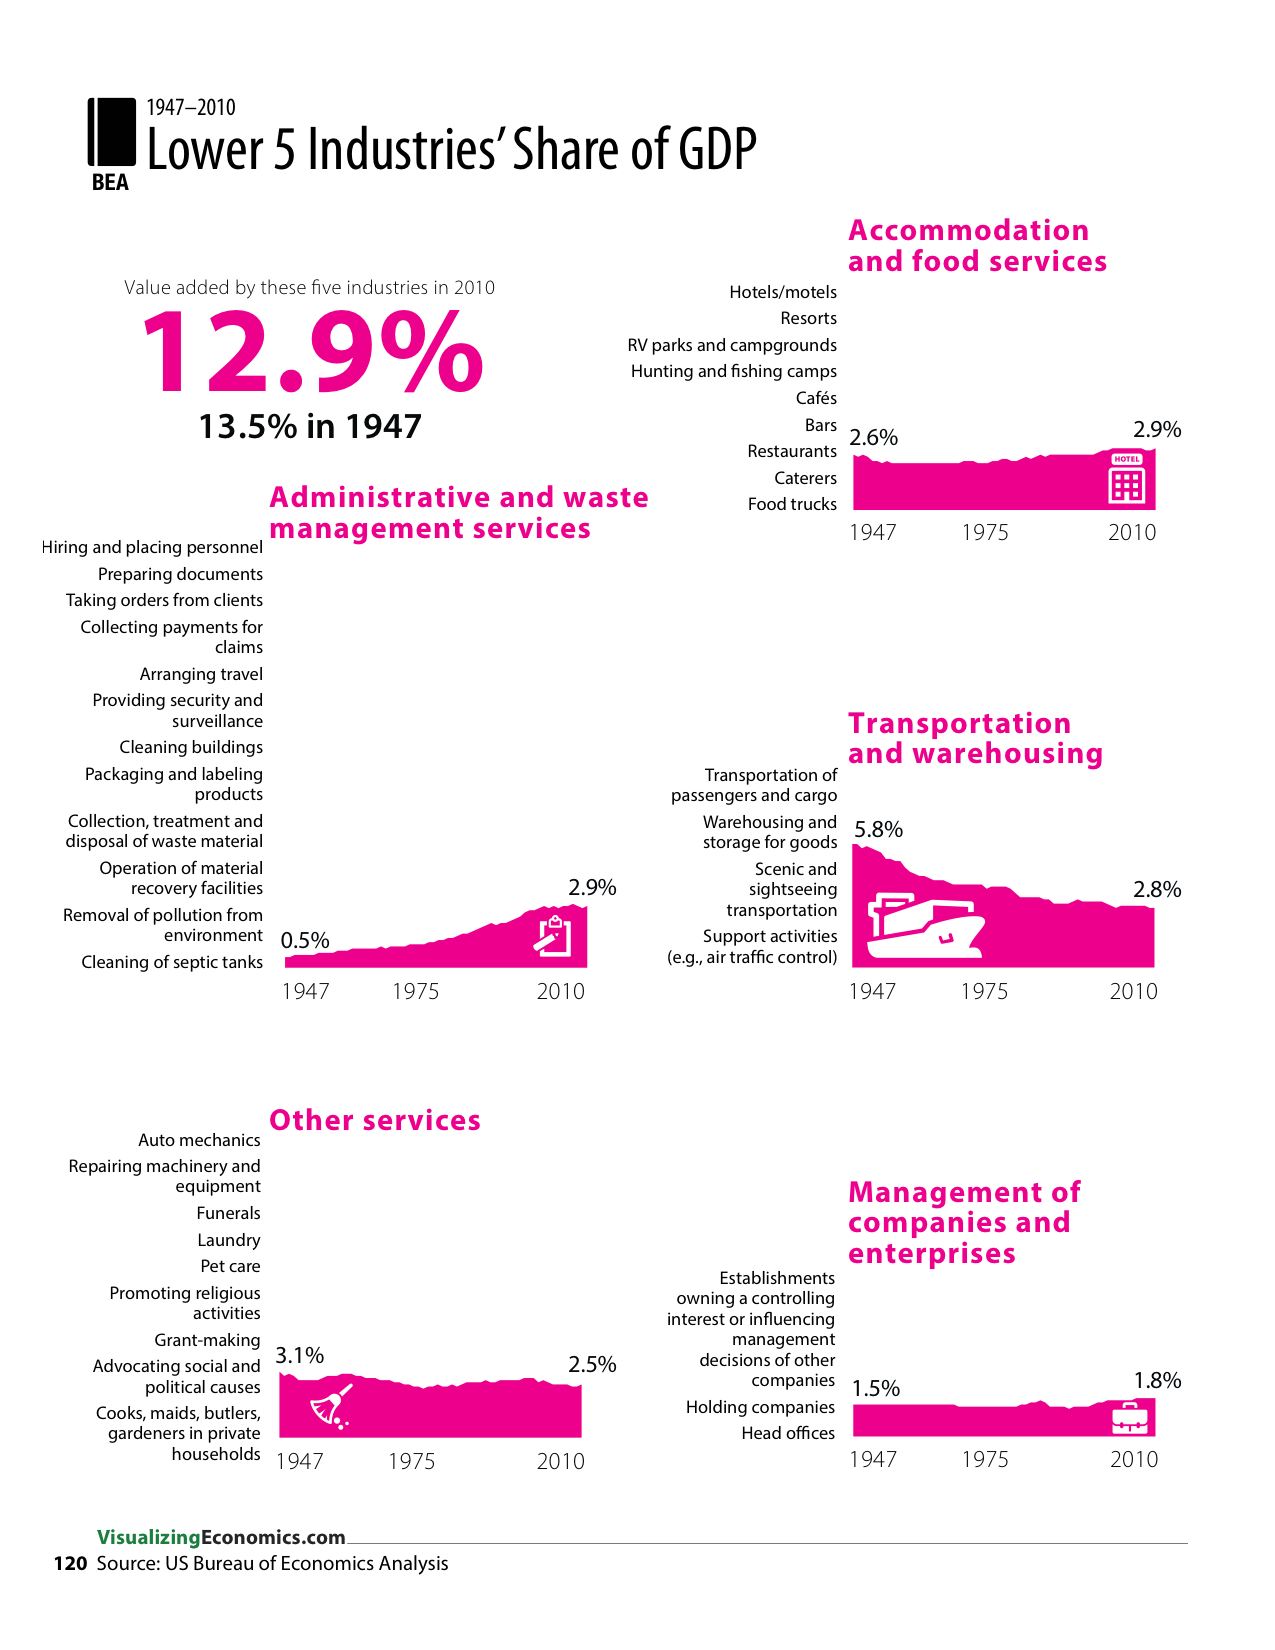
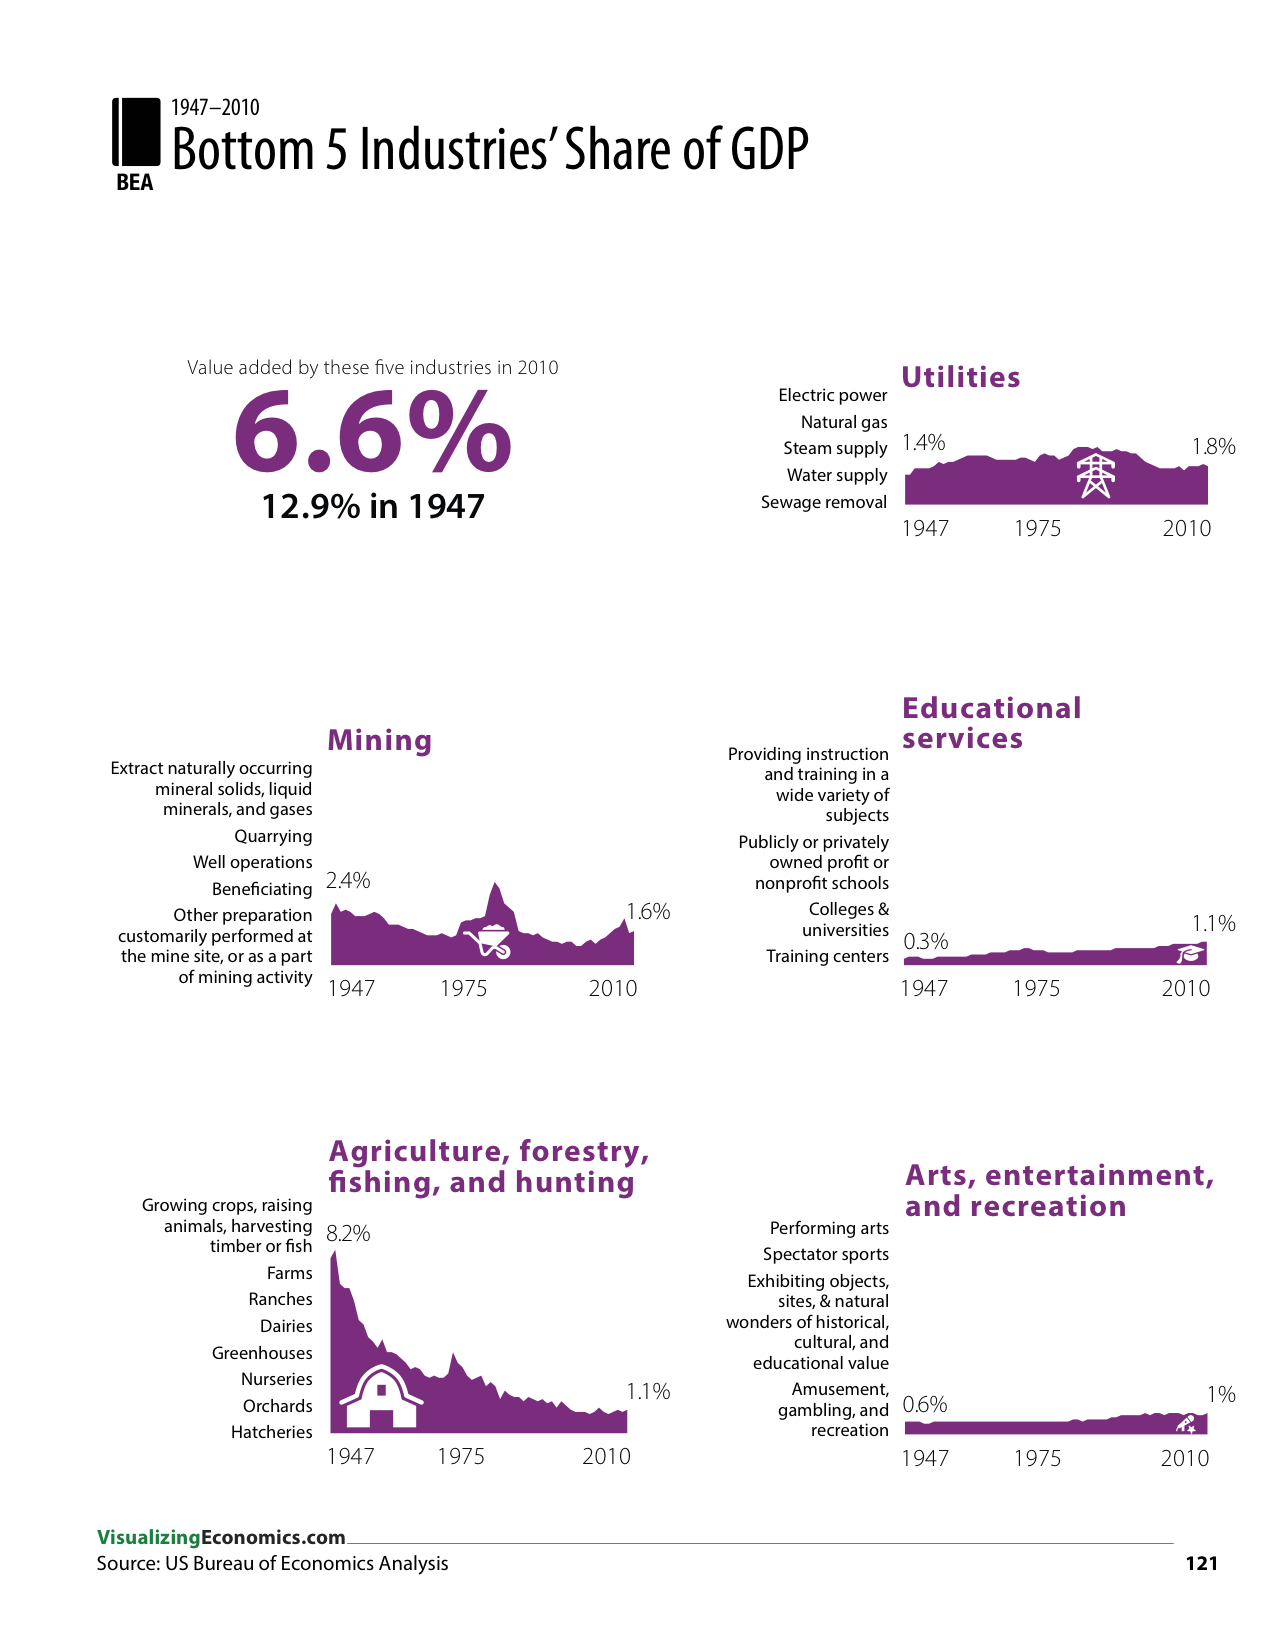
During the course of making my book, I took a look at the GDP Industry data from the Bureau of Economics Analysis and I decided to graph the 60 years of data showing the share of each industry in the US economy. Each graph is on the same x- and y-scales to support comparisons across all of them. At the same time I thought it would be helpful to list out some of the activities found in each industry so that these charts could be used as an introduction to the dataset. FInally, I ordered the industries from the largest to smallest across four pages.
Each area graph was created with OmniGraphSketcher and the final layout and annotations were made using Illustrator.
Datasource: US Bureau of Economic Analysis. “Gross Domestic Product (GDP) by Industry Data.” June 2012. http://www.bea.gov/industry/gdpbyind_data.htm.