

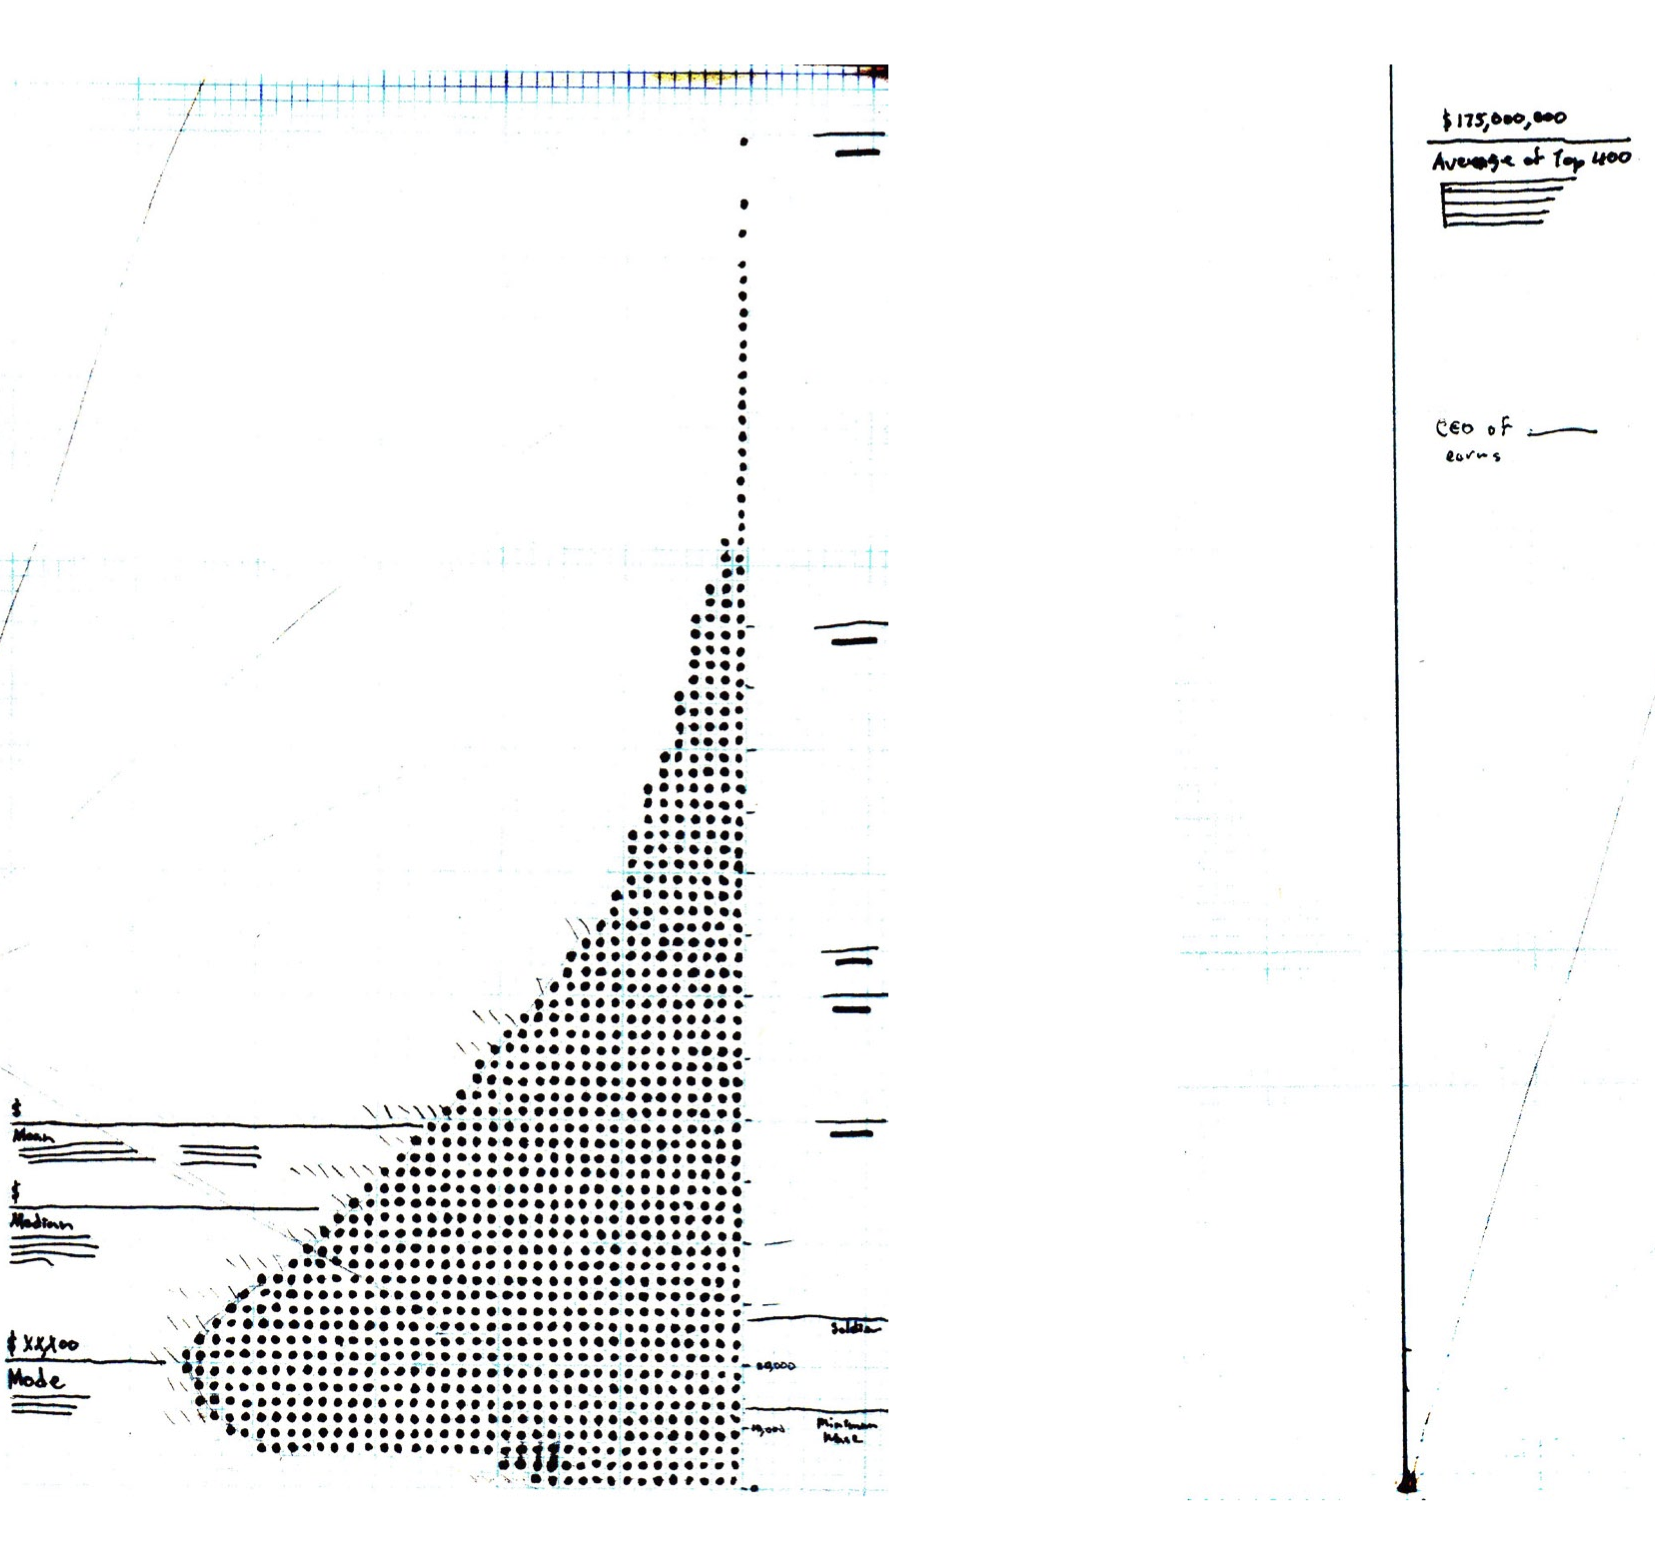
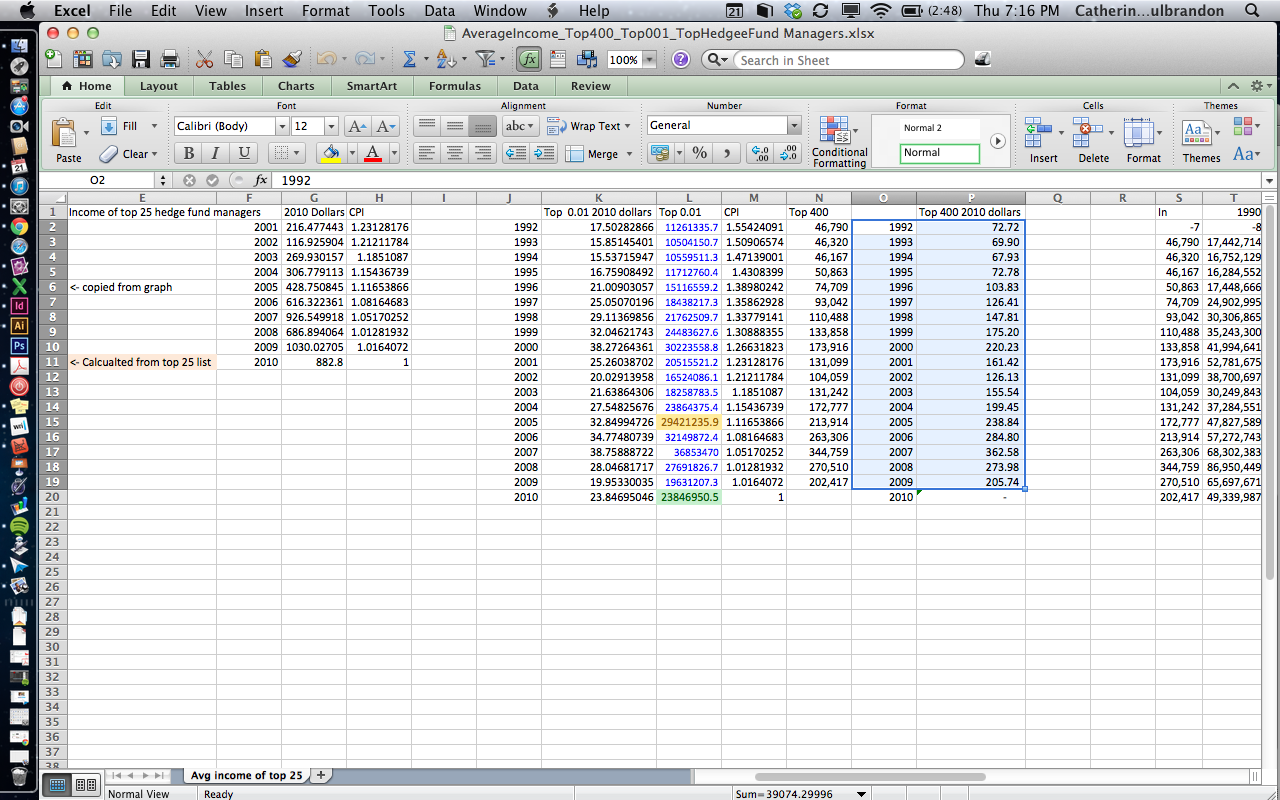
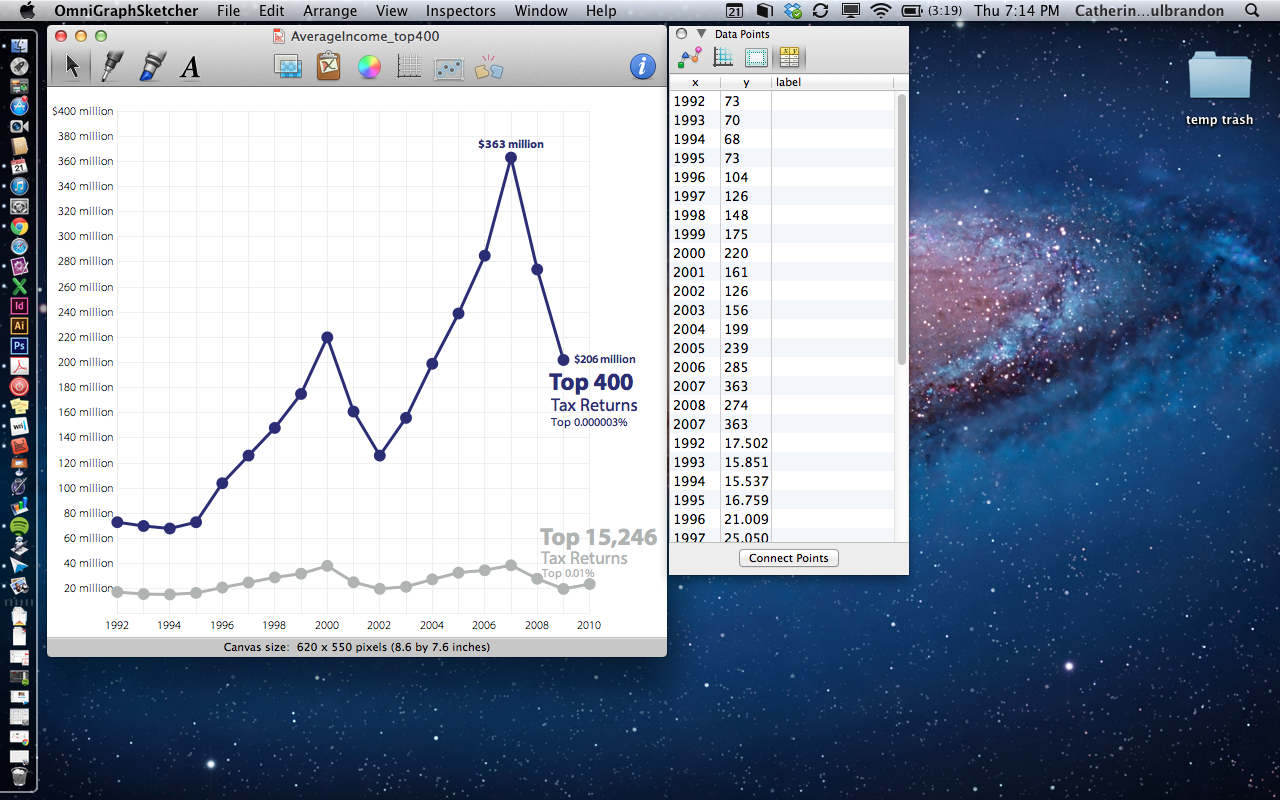
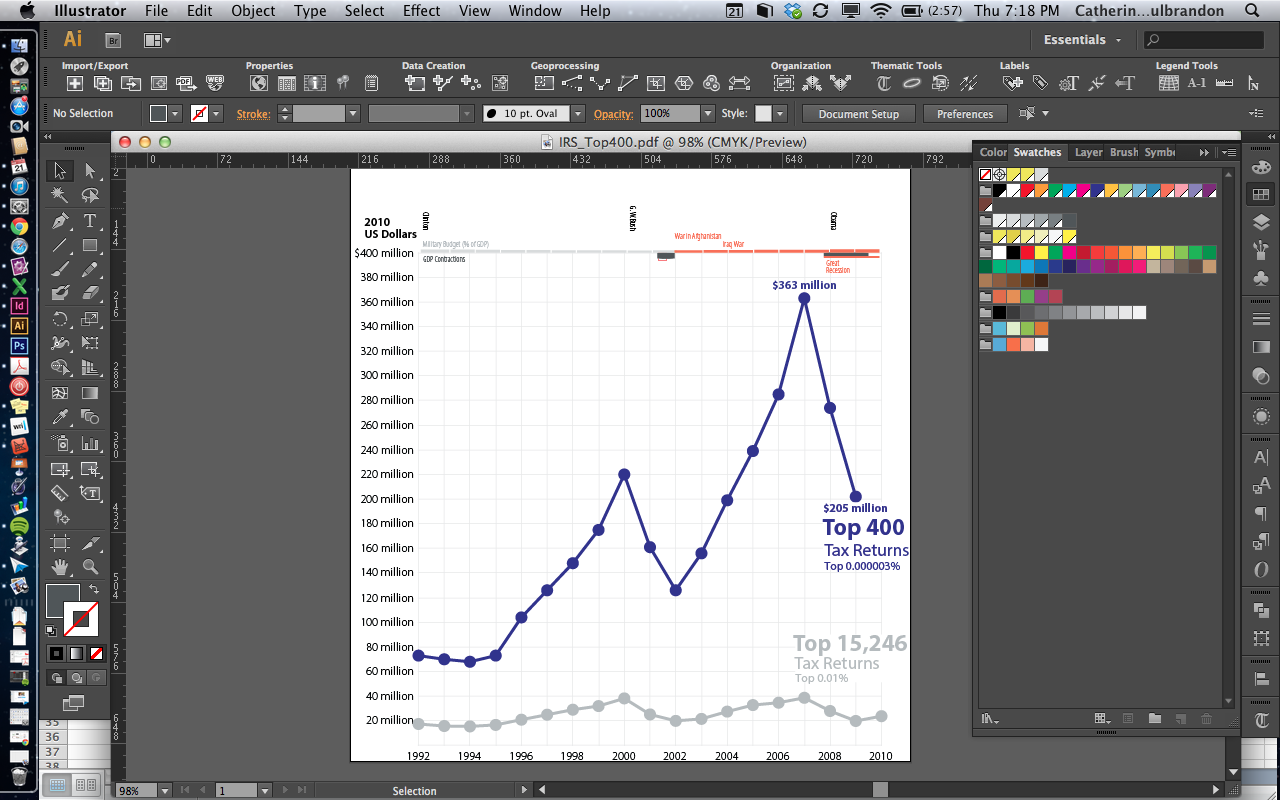
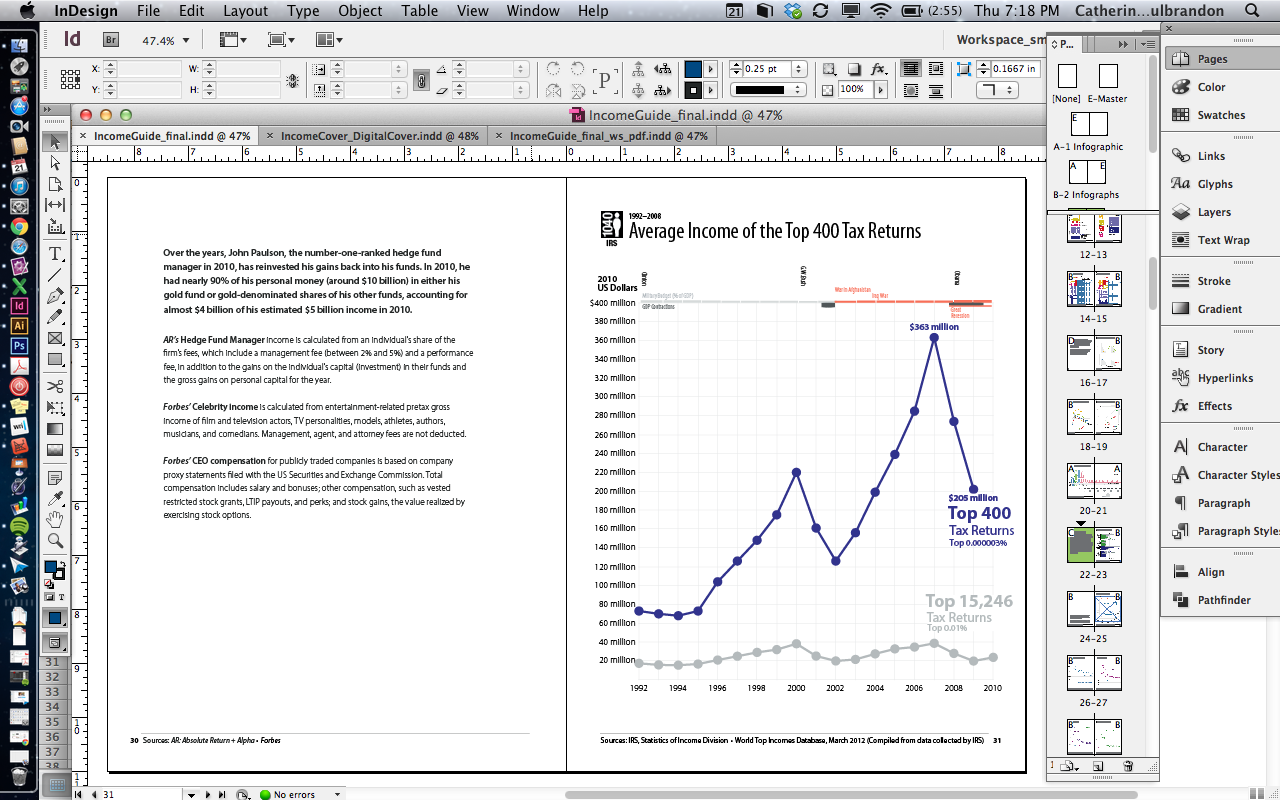

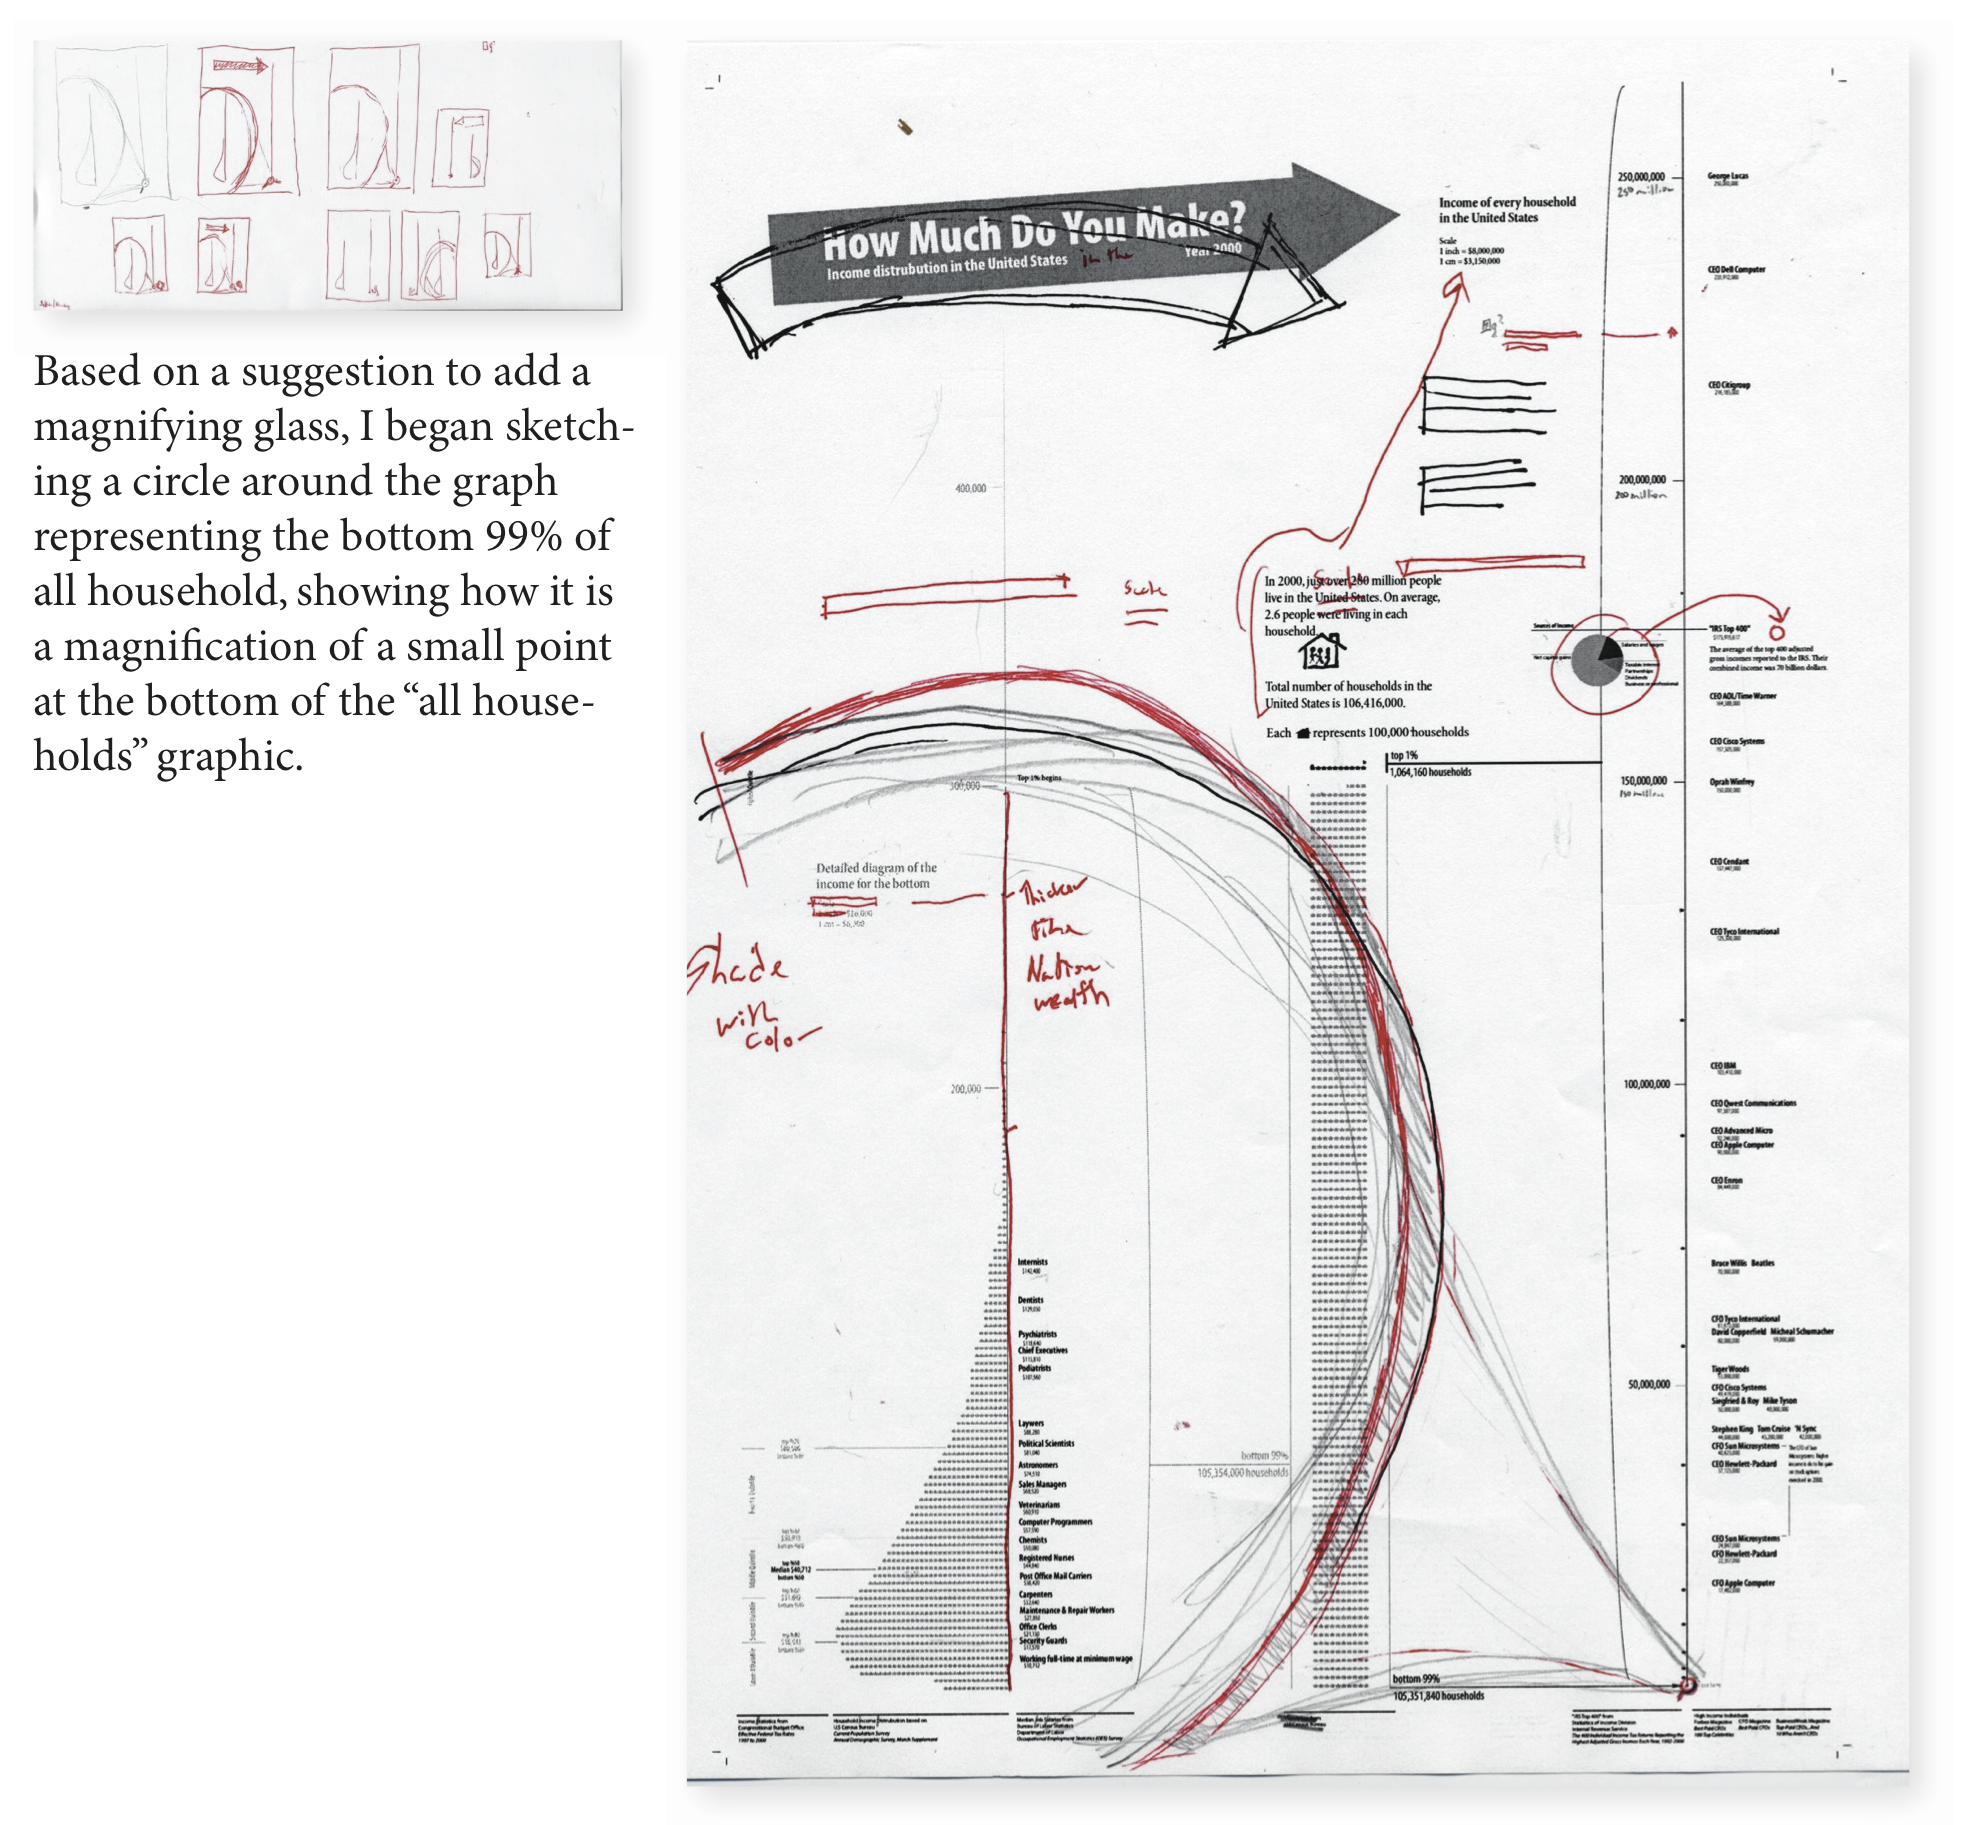
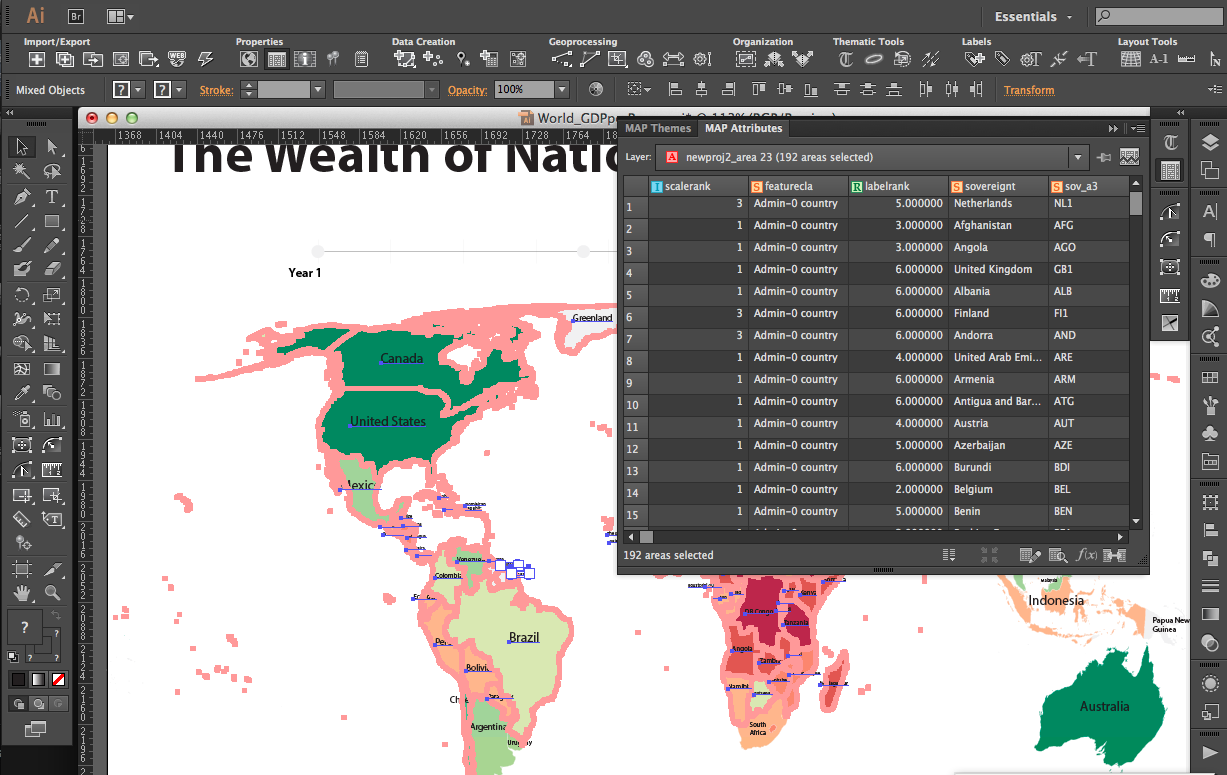
These days most of my work starts with formatting and reviewing the the data in Excel then copying it into OmniGraphSketcher to create the graph. For more complex graphics, I will also sketch ideas on paper because then I am not limited by the software when I what to come up with ideas.. If I need to layout multiple graphs together, I copy these graphs into Illustrator. I will also use R Statistical Package to make treemaps but then annotate them in Illustrator. For maps, I work with my brother, an urban geographer, to create the shape and data files then use a plugin for Illustrator called MAPublisher to make the final map. I use Illustrator because it gives me more control over the final design. (However, for interactive dashboards Tableau, visually, is the best software I have found.) Finally, I used InDesign to layout the pages of An Illustrated Guide to Income in the United States.