Mastodon

Population

6 Real World Examples of Exponential Growth in Powerpoint

Real Word Examples of Exponential Growth
Sale Price:$2.25 Original Price:$4.50

After receiving requests to use some of my graphs in textbooks, emails from teachers and recommendations by EducationWorld and the Library of Congress, I decided to create a series of Powerpoint presentations for teachers. In my first Powerpoint slide deck, I have created and updated examples of exponential growth in economics and finance. This historical data is annotated by major events and covers, in some cases, 200 years of US history. They are useful for interdisciplinary classwork in economics, social studies history as well as math. Besides demonstrating how the logarithmic scale works, this collection of graphs provides examples that show how log scales can illustrate percent changes and growth rates. 

I release my work with a CREATIVE COMMONS BY-NC license so you are free to share/copy these graphs for educational or personal use after you purchase it.

See other product for sale in my shop

Related Posts Plugin for WordPress, Blogger...

Half the world’s population lives in 6 countries

A new series looking at Fun Facts! about US and World economies. I am starting with something simple: In 2009, 50% of the world’s 6.8 billion people lived in just 6 countries: China, India, United States, Indonesia, Brazil and Pakistan.

If you want to look up the population for the rest for the world try the World Bank's data tool.

Related Posts Plugin for WordPress, Blogger...

North America Income, Education, Employment: 2006

US Population Ancestry

Screenshot from an interactive mapping tool from OECD Regional Statistics. While you can look at any region I choose North America. The color indicates the GDP per capita: blue is low income while red is high income. The graph on the right is comparing % of population with high school education vs unemployment. (The red circle, indicating very high income, belongs to Washington DC) {Click on the image to take a closer look}


Related Posts Plugin for WordPress, Blogger...

US Ancestry: 2000

"The Census Bureau defines ancestry as a person's ethnic origin, heritage, descent, or roots, which may reflect their place of birth, place of birth of parents or ancestors, and ethnic identities that have evolved within the United States." from a Census brief on US ancestry. The map below displays the ancestry with the largest population in each county. However, they may not be a majority (>50%) of the population. {Click on the image to take a closer look} US Population Ancestry magnifying glass

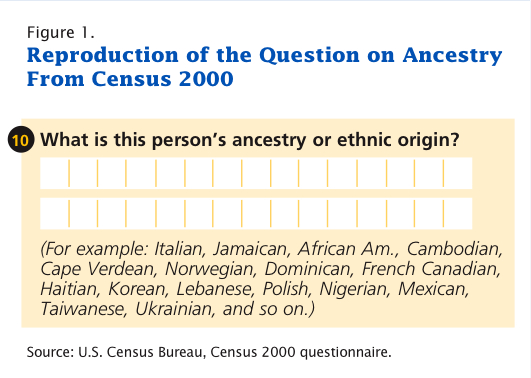
Below is the question that was presented on the long form of the US Census. "In 2000, 58 percent of the population specified only one ancestry, 22 percent provided two ancestries, and 1 percent reported an unclassifiable ancestry such a mixture or adopted. Another 19 percent did not report any ancestry at all."

{Click on the image to take a closer look} US Population Ancestry magnifying glass

[tags]United States, Population[/tags]

Related Posts Plugin for WordPress, Blogger...