Mastodon

Exponential Growth

6 Real World Examples of Exponential Growth in Powerpoint

Real Word Examples of Exponential Growth
Sale Price:$2.25 Original Price:$4.50

After receiving requests to use some of my graphs in textbooks, emails from teachers and recommendations by EducationWorld and the Library of Congress, I decided to create a series of Powerpoint presentations for teachers. In my first Powerpoint slide deck, I have created and updated examples of exponential growth in economics and finance. This historical data is annotated by major events and covers, in some cases, 200 years of US history. They are useful for interdisciplinary classwork in economics, social studies history as well as math. Besides demonstrating how the logarithmic scale works, this collection of graphs provides examples that show how log scales can illustrate percent changes and growth rates. 

I release my work with a CREATIVE COMMONS BY-NC license so you are free to share/copy these graphs for educational or personal use after you purchase it.

See other product for sale in my shop

Related Posts Plugin for WordPress, Blogger...

What Happened to Wages?

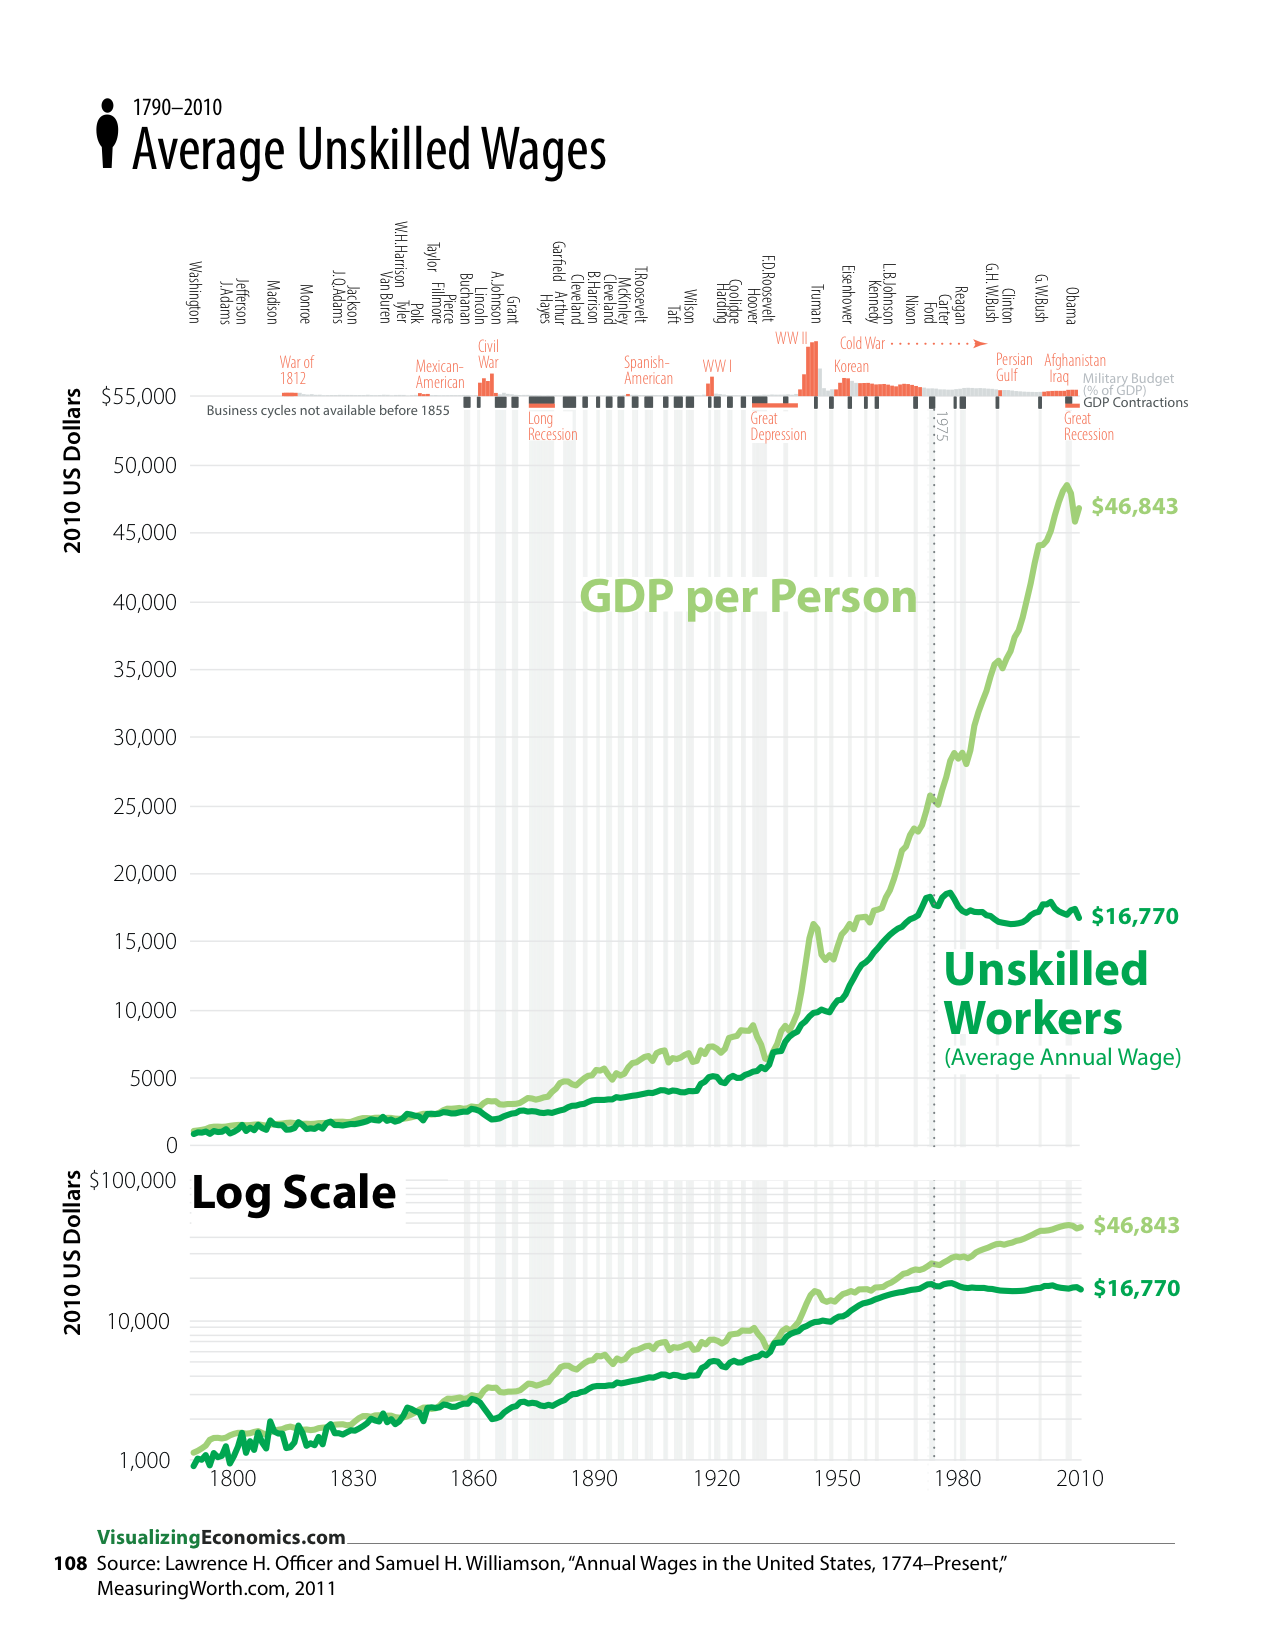
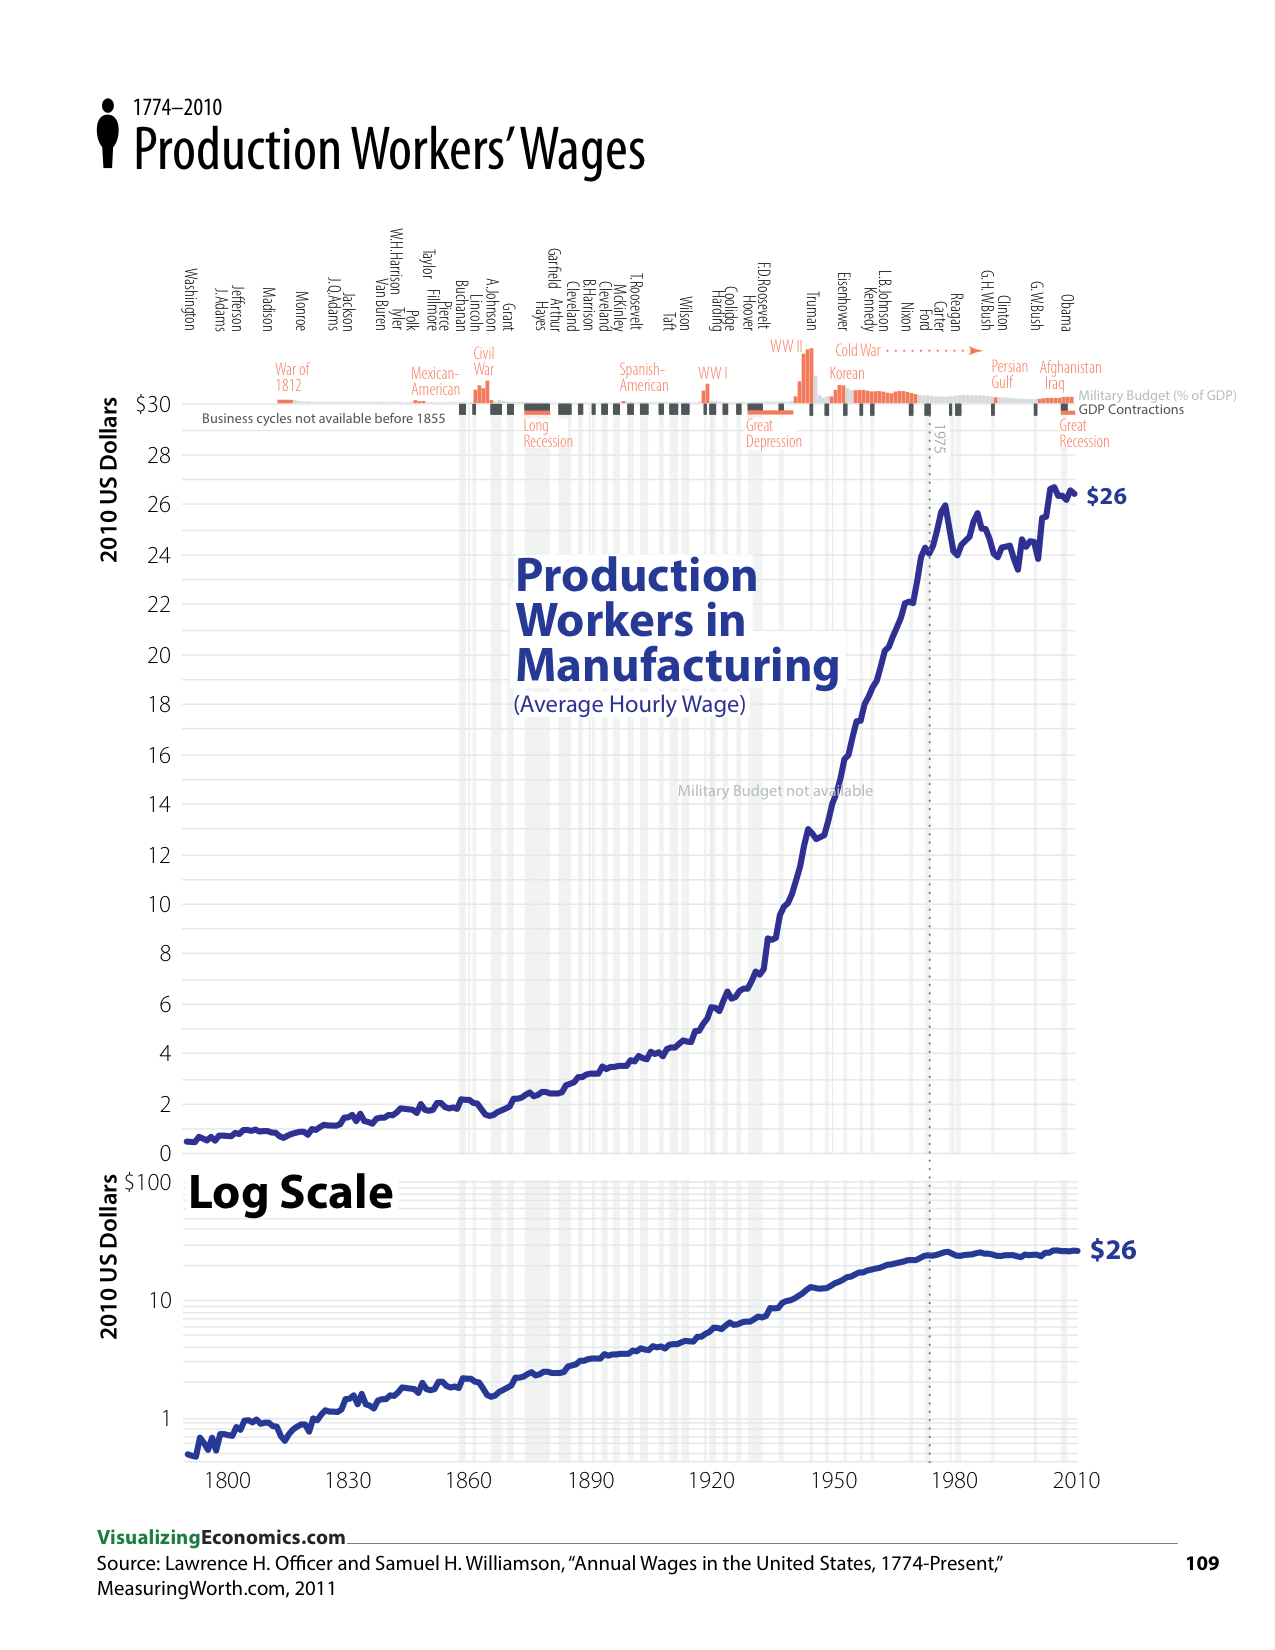
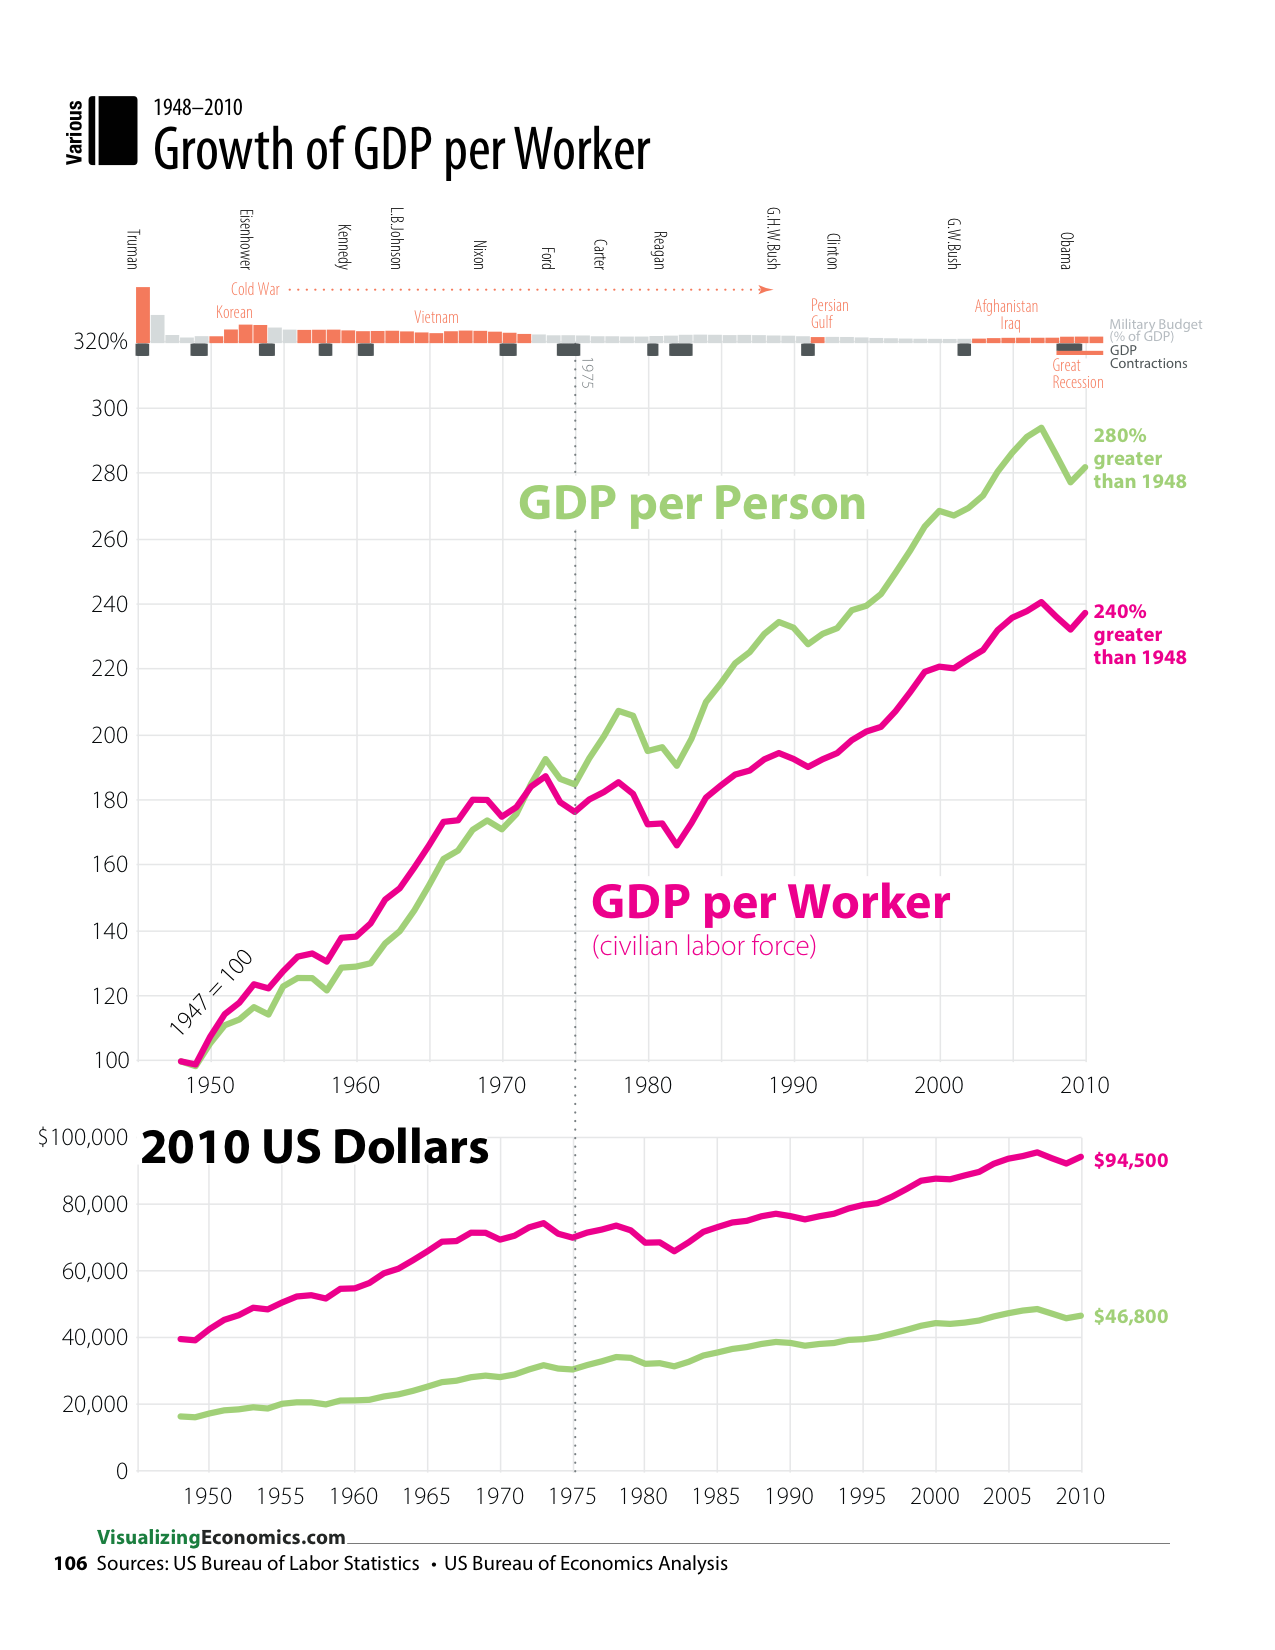
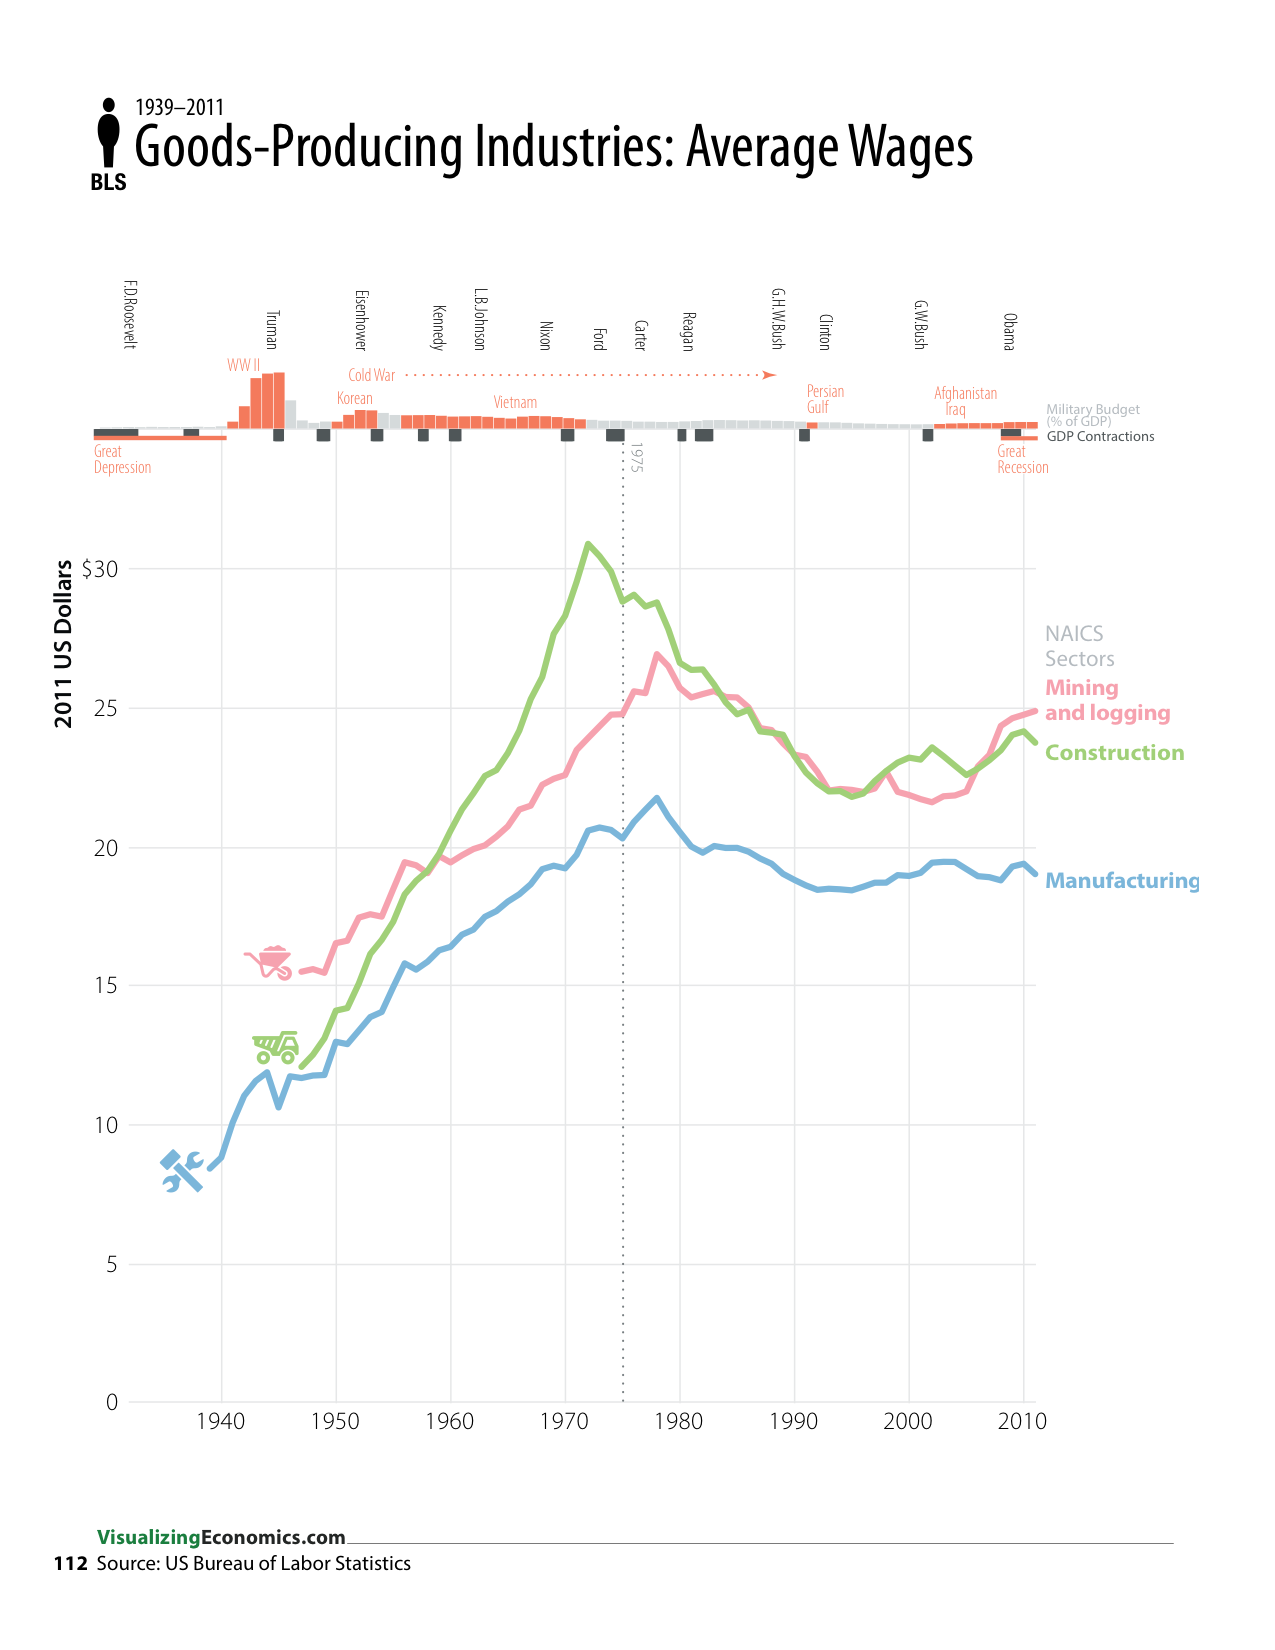
Below are five data graphics from my new book An Illustrated Guide to Income in the United States (pgs 106, 108, 109, 110, 112) that shows the long-term growth in wages in the US.


Click on the images for a closer look. This will open a lightbox the same size as the browser window.

Over the last couple of centuries there has been a steady increase in wages for both unskilled workers...

....and production workers. A lot of this growth is a result of the increases in worker productivity due the industrial revolution of the late 1770s and 1800s. However, over the last 40 years, this long-term growth has stopped or slowed down...

Updated 3/25/13: This Production Workers series includes benefits all the way back to when benefits became measurable in the early 1900s. More detailed definition can be found here.


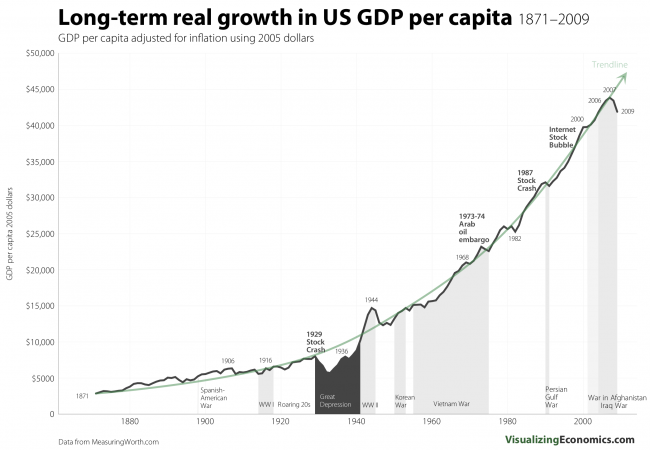
...even though the GDP per person continues to grow. At the same time, the growth rate of GDP per worker has slowed compared to the overall growth of the economy.

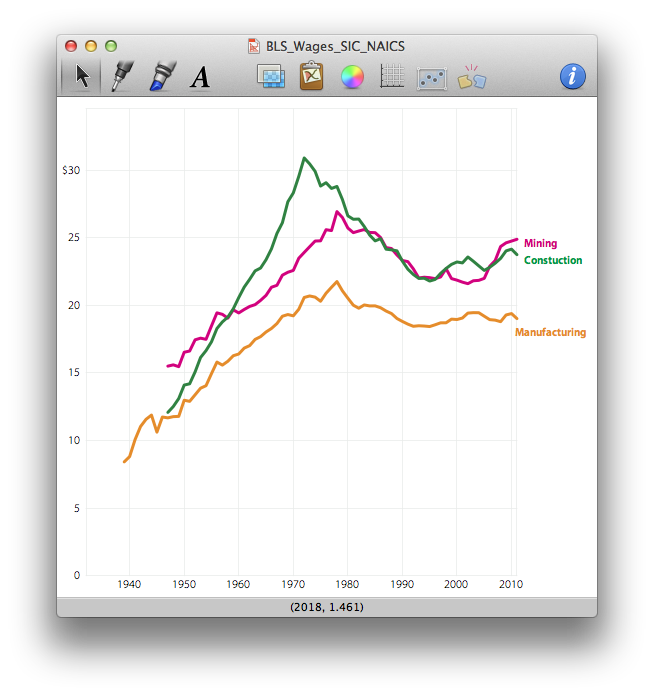
Looking at just goods-producing industries, wages dropped for manufacturing, construction, and mining & logging since their a peak in the 1970s.


But among so-called service industries over the same time period there has been either a dip in wages or no real growth. Exceptions include jobs in the financial industry, education & health services and "other" services (which is mashup of occupations like auto mechanics, pet care, promoting political causes or religious activities). 

Data Sources for Wages (See bibliography for more references)

Officer, Lawrence H., and Samuel H. Williamson. “Annual Wages in the United States, 1774–Present.” MeasuringWorth.com, 2011. http://www.measuringworth.com/uswage/

US Bureau of Labor Statistics. “Table B-8. Average hourly and weekly earnings of production and nonsupervisory employees on private nonfarm payrolls by industry sector, seasonally adjusted.” November 2012. http://www.bls.gov/webapps/legacy/cesbtab8.htm


Designer's Notes: Some of my thoughts on the design and the approaches I used. 

Related Posts Plugin for WordPress, Blogger...

(Log Scale) Long-term real growth in US GDP 1871-2009

Log scale version of yesterday's Real Growth of US GDP graph. If you look at the Long-term Stock Growth graph, the slope of the trendline looks similar to the US GDP trendline. However, when you calculate their annualized growth rate from 1871-2009 you get:

  • Annualized Real Stocks Price Growth    1.95%
  • Annualized Real GDP Growth                3.47%

Real Word Examples of Exponential Growth
Sale Price:$2.25 Original Price:$4.50

Six real word examples of exponential growth in a Powerpoint slide show (3.7 MB) that includes 11 graphs of economic and financial data (linear and log scale). Data is from MeasuringWorth.orgYahoo Finance, and Irrational Exuberance. Links to the data sets are included in the file. Images can be printed (B&W or color) for handouts.

  • Real US GDP 1790-2012 (Linear & Log Graphs)
  • Real US Stock Prices 1871-2012 (Linear & Log Graphs)
  • General Electric Stock Price 1962-2013  (Linear & Log Graphs)
  • US Population 1790-2012 (Linear & Log Graphs)
  • Inflation Index 1774-2012 (Linear & Log Graphs) 
  • US GDP & Population 1790-2012 (Log Graph)

These graphs illustrate historical data series with constant growth rates and data series with changing growth rates over time. In addition, there is a example of adding/subtracting growth rates in log graph using US GDP, US Population & US GDP per person. 

*** A few of people have had difficulty downloading in Firefox, if the download link does not work, try to copying the link into another browser. ***

Related Posts Plugin for WordPress, Blogger...

Long-term real growth in US GDP 1871-2009

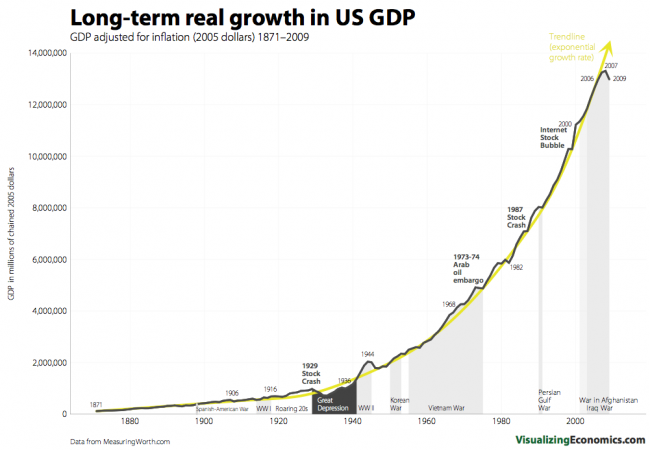
This time I am plotting United States GDP as a comparison to my first graph US Stock Market Growth since 1871 in this series. You will notice that the 2009 US GDP dropped to 2005-2006 levels as a result of the recent financial crises. Log scale version coming tomorrow.


Real Word Examples of Exponential Growth
Sale Price:$2.25 Original Price:$4.50

Six real word examples of exponential growth in a Powerpoint slide show (3.7 MB) that includes 11 graphs of economic and financial data (linear and log scale). Data is from MeasuringWorth.orgYahoo Finance, and Irrational Exuberance. Links to the data sets are included in the file. Images can be printed (B&W or color) for handouts.

  • Real US GDP 1790-2012 (Linear & Log Graphs)
  • Real US Stock Prices 1871-2012 (Linear & Log Graphs)
  • General Electric Stock Price 1962-2013  (Linear & Log Graphs)
  • US Population 1790-2012 (Linear & Log Graphs)
  • Inflation Index 1774-2012 (Linear & Log Graphs) 
  • US GDP & Population 1790-2012 (Log Graph)

These graphs illustrate historical data series with constant growth rates and data series with changing growth rates over time. In addition, there is a example of adding/subtracting growth rates in log graph using US GDP, US Population & US GDP per person. 

*** A few of people have had difficulty downloading in Firefox, if the download link does not work, try to copying the link into another browser. ***

Related Posts Plugin for WordPress, Blogger...