Here, I have graphed the percent of world population over the last 500 years for China, India, Africa, Latin America, Western Europe, and United States. This is a companion graph to Comparing Population Growth: China, India, Africa, Latin America, Western Europe, United States
See also: China: 2,000 Years of Income and Population GrowthLast 2,000 years of growth in world income and population
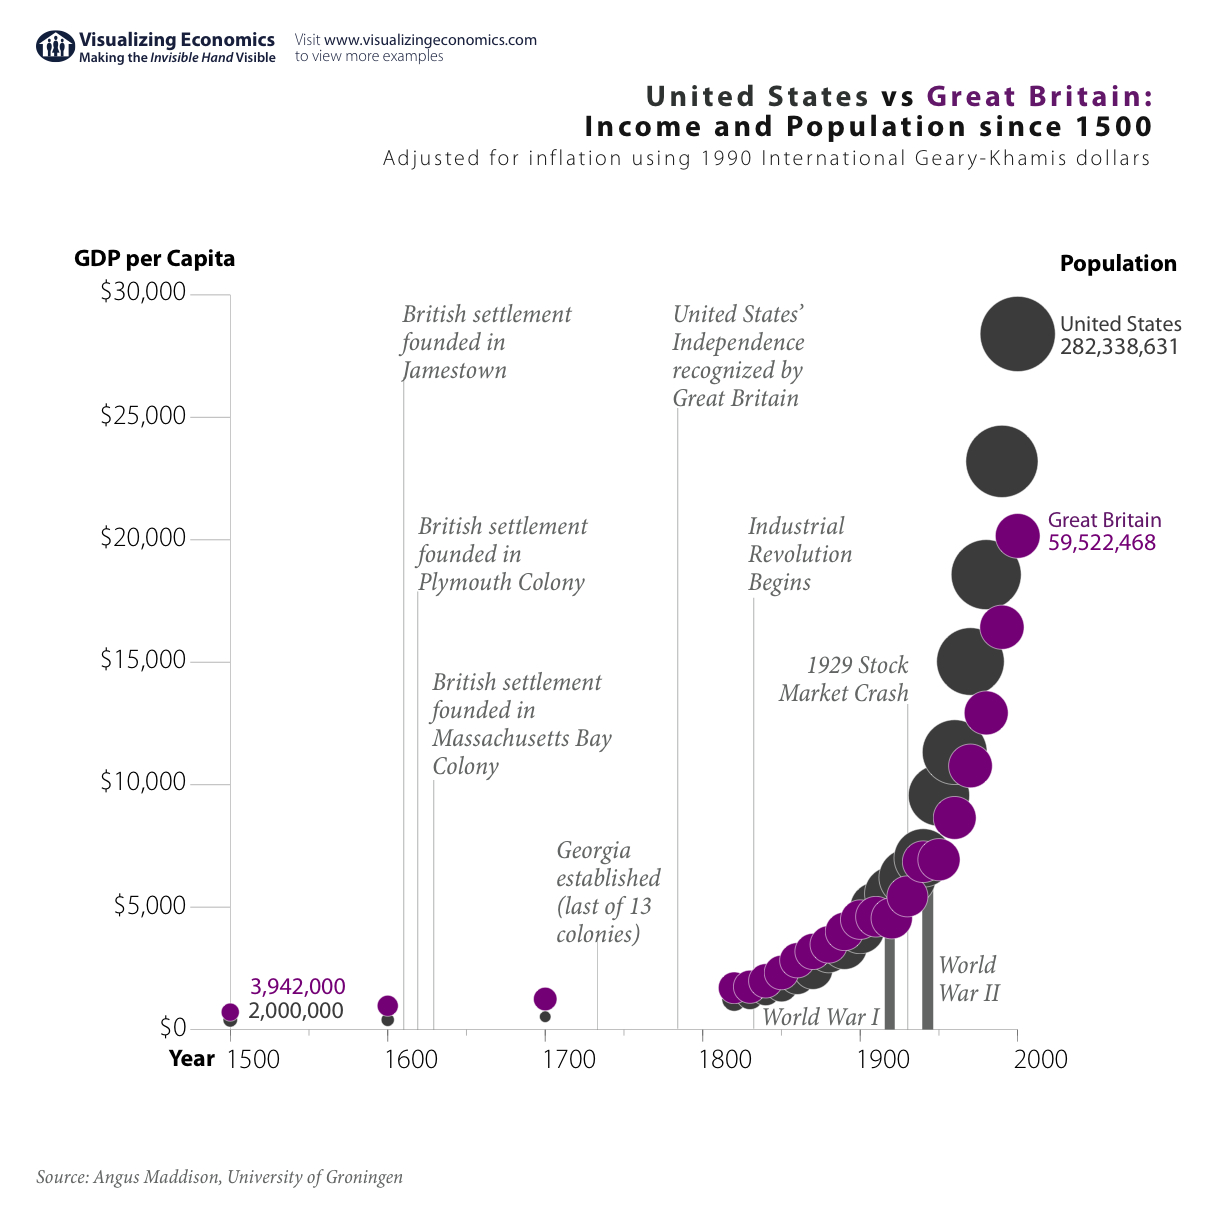
Data estimates for population from Angus Maddison Emeritus Professor, Faculty of Economics, University of Groningen.