Mastodon

United Kingdom

United States vs Great Britain (Revised)

I am revisiting my previous graph United States vs Great Britain: Income and Population since 1500. In my original graph, I placed population on the y-axis which emphasizes its dramatic growth in the US. In the new graph, I placed GDP per Capita on the y-axis which emphasizes the growth in income in both countries. Take a look below at both versions and let me know which you prefer:

New Version: GDP per Capita on the y-axis {Click on the image to take a closer look}
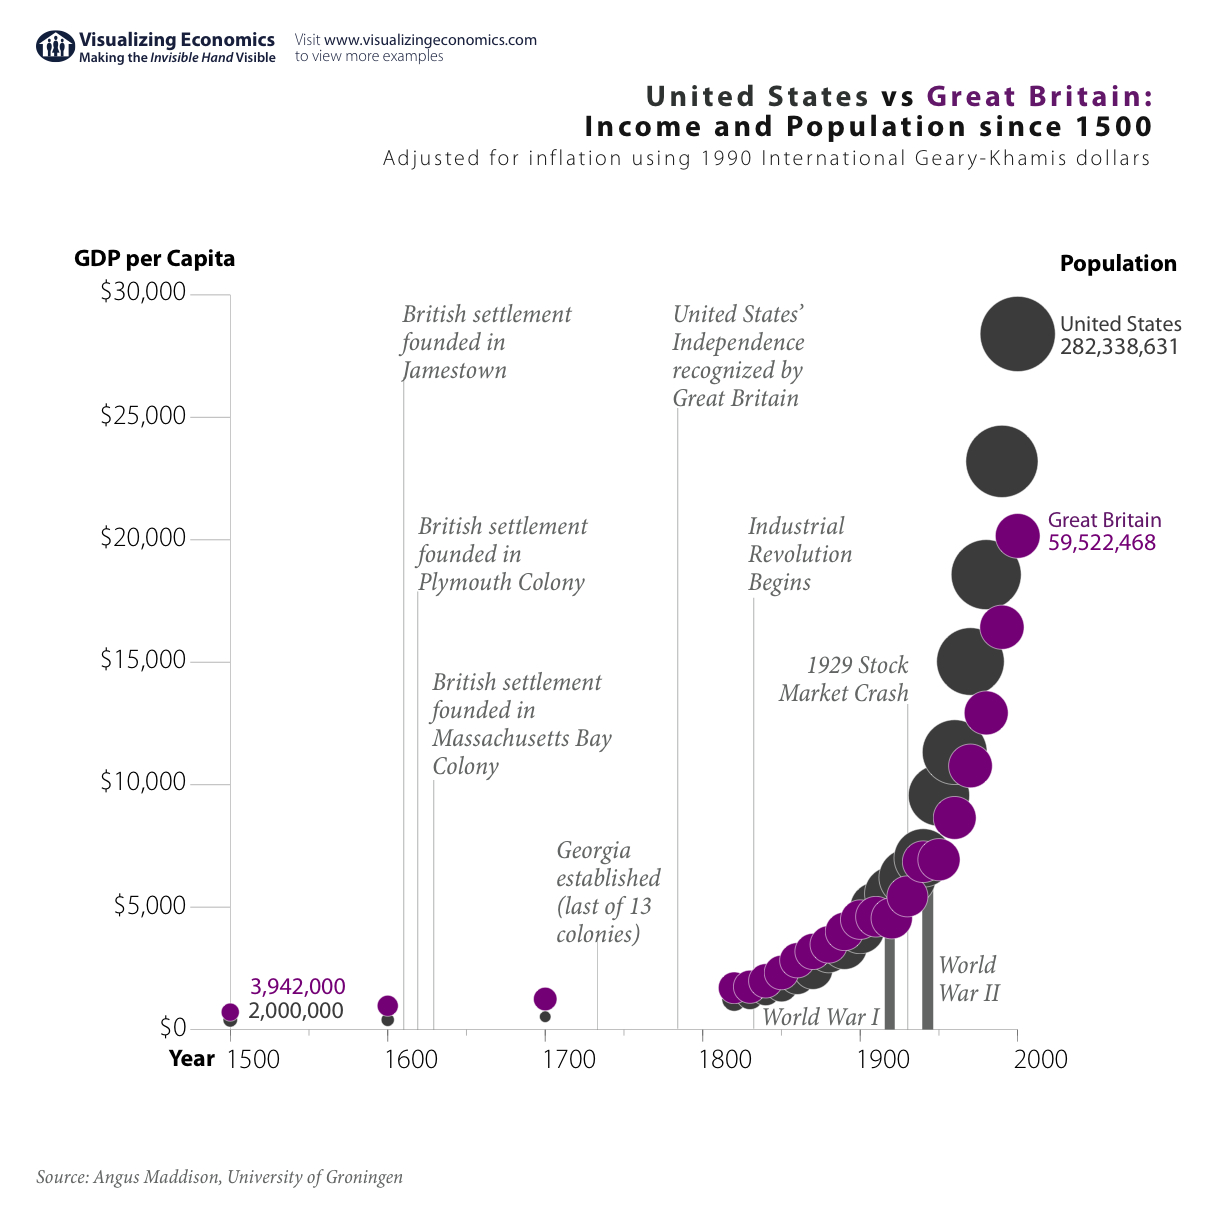
UK Income and Population growth since 1500
magnifying glass

Original Version: Population on the y-axis {Click on the image to take a closer look}

UK Income and Population growth since 1500
Related Posts Plugin for WordPress, Blogger...

United States vs Great Britain: Income and Population since 1500

UK Income and Population growth since 1500

Comparing United States vs Great Britain's income and population over the last 500 years shows how the US eventually over took Britain. Keep in mind that GDP per Capita for both countries are in 1990 international Geary-Khamis dollars, calculated from purchasing power parities (PPPs) of currencies and average prices of commodities. {Click on the image to take a closer look}

See also:United States: 500 Years of Income and Population GrowthComparing Population Growth: China, India, Africa, Latin America, Western Europe, United StatesChina: 2,000 Years of Income and Population GrowthLast 2,000 years of growth in world income and population

Data estimates for population from Angus Maddison Emeritus Professor, Faculty of Economics, University of Groningen.

Related Posts Plugin for WordPress, Blogger...

Comparing Income of Top 0.1 Percent in Five Countries

I created these graphs to show the change in the share of income going to the top 0.1%, comparing the United States to Canada, United Kingdom, France, and Japan from 1913-2004.

The effect by the two World Wars is clear but what is more subtle is the effect on the share of income going to the very wealthy due to the change in the top income tax rate. This could be due to attempts by the very wealthy to hide their income from the IRS or else having a higher tax rate will impact the distribution of income or both. I didn't have the marginal rates for the other countries but it would be interesting to see if they have a similar relationship between the share of total income captured by the Top 0.1 percent and income tax rates.

The income data can be found here on Emmanuel Saez's web site. I found the marginal tax rate for the United States in the SOI Bulletin Historical Table A at the IRS site via truthandpolitics.org

Related Posts Plugin for WordPress, Blogger...

Income Inequality in Britain and America

A quick link to a paper I found at the World Bank web site:When did inequality rise in Britain and America?

From the Abstract:

. . . income inequality rose in both Britain and America between 1977 and 1995. In America, it regained the old pre-1929 levels, contrary to the official figures. Second, wealth and earnings gaps widened sometime in America between 1774 and 1913. Third, inequality rose in Britain from 1740 to 1810, earlier than others have suspected . . .

Related Posts Plugin for WordPress, Blogger...